Montana's special education graduation rate was 69.2% in 2011. In 2020, it was 75.5%. That looks like improvement -- and it is, technically, a gain of 6.3 percentage points. But the trajectory between those two endpoints is not a climb. It is a bounce.
The rate spiked to 80.6% in 2012, then dropped. It hit 75.2% in 2015, recovered to 78.0% in 2019, then dropped again. Over a decade, the special education graduation rate in Montana has oscillated around 76%, never establishing a sustained trend in either direction.
The 75% ceiling
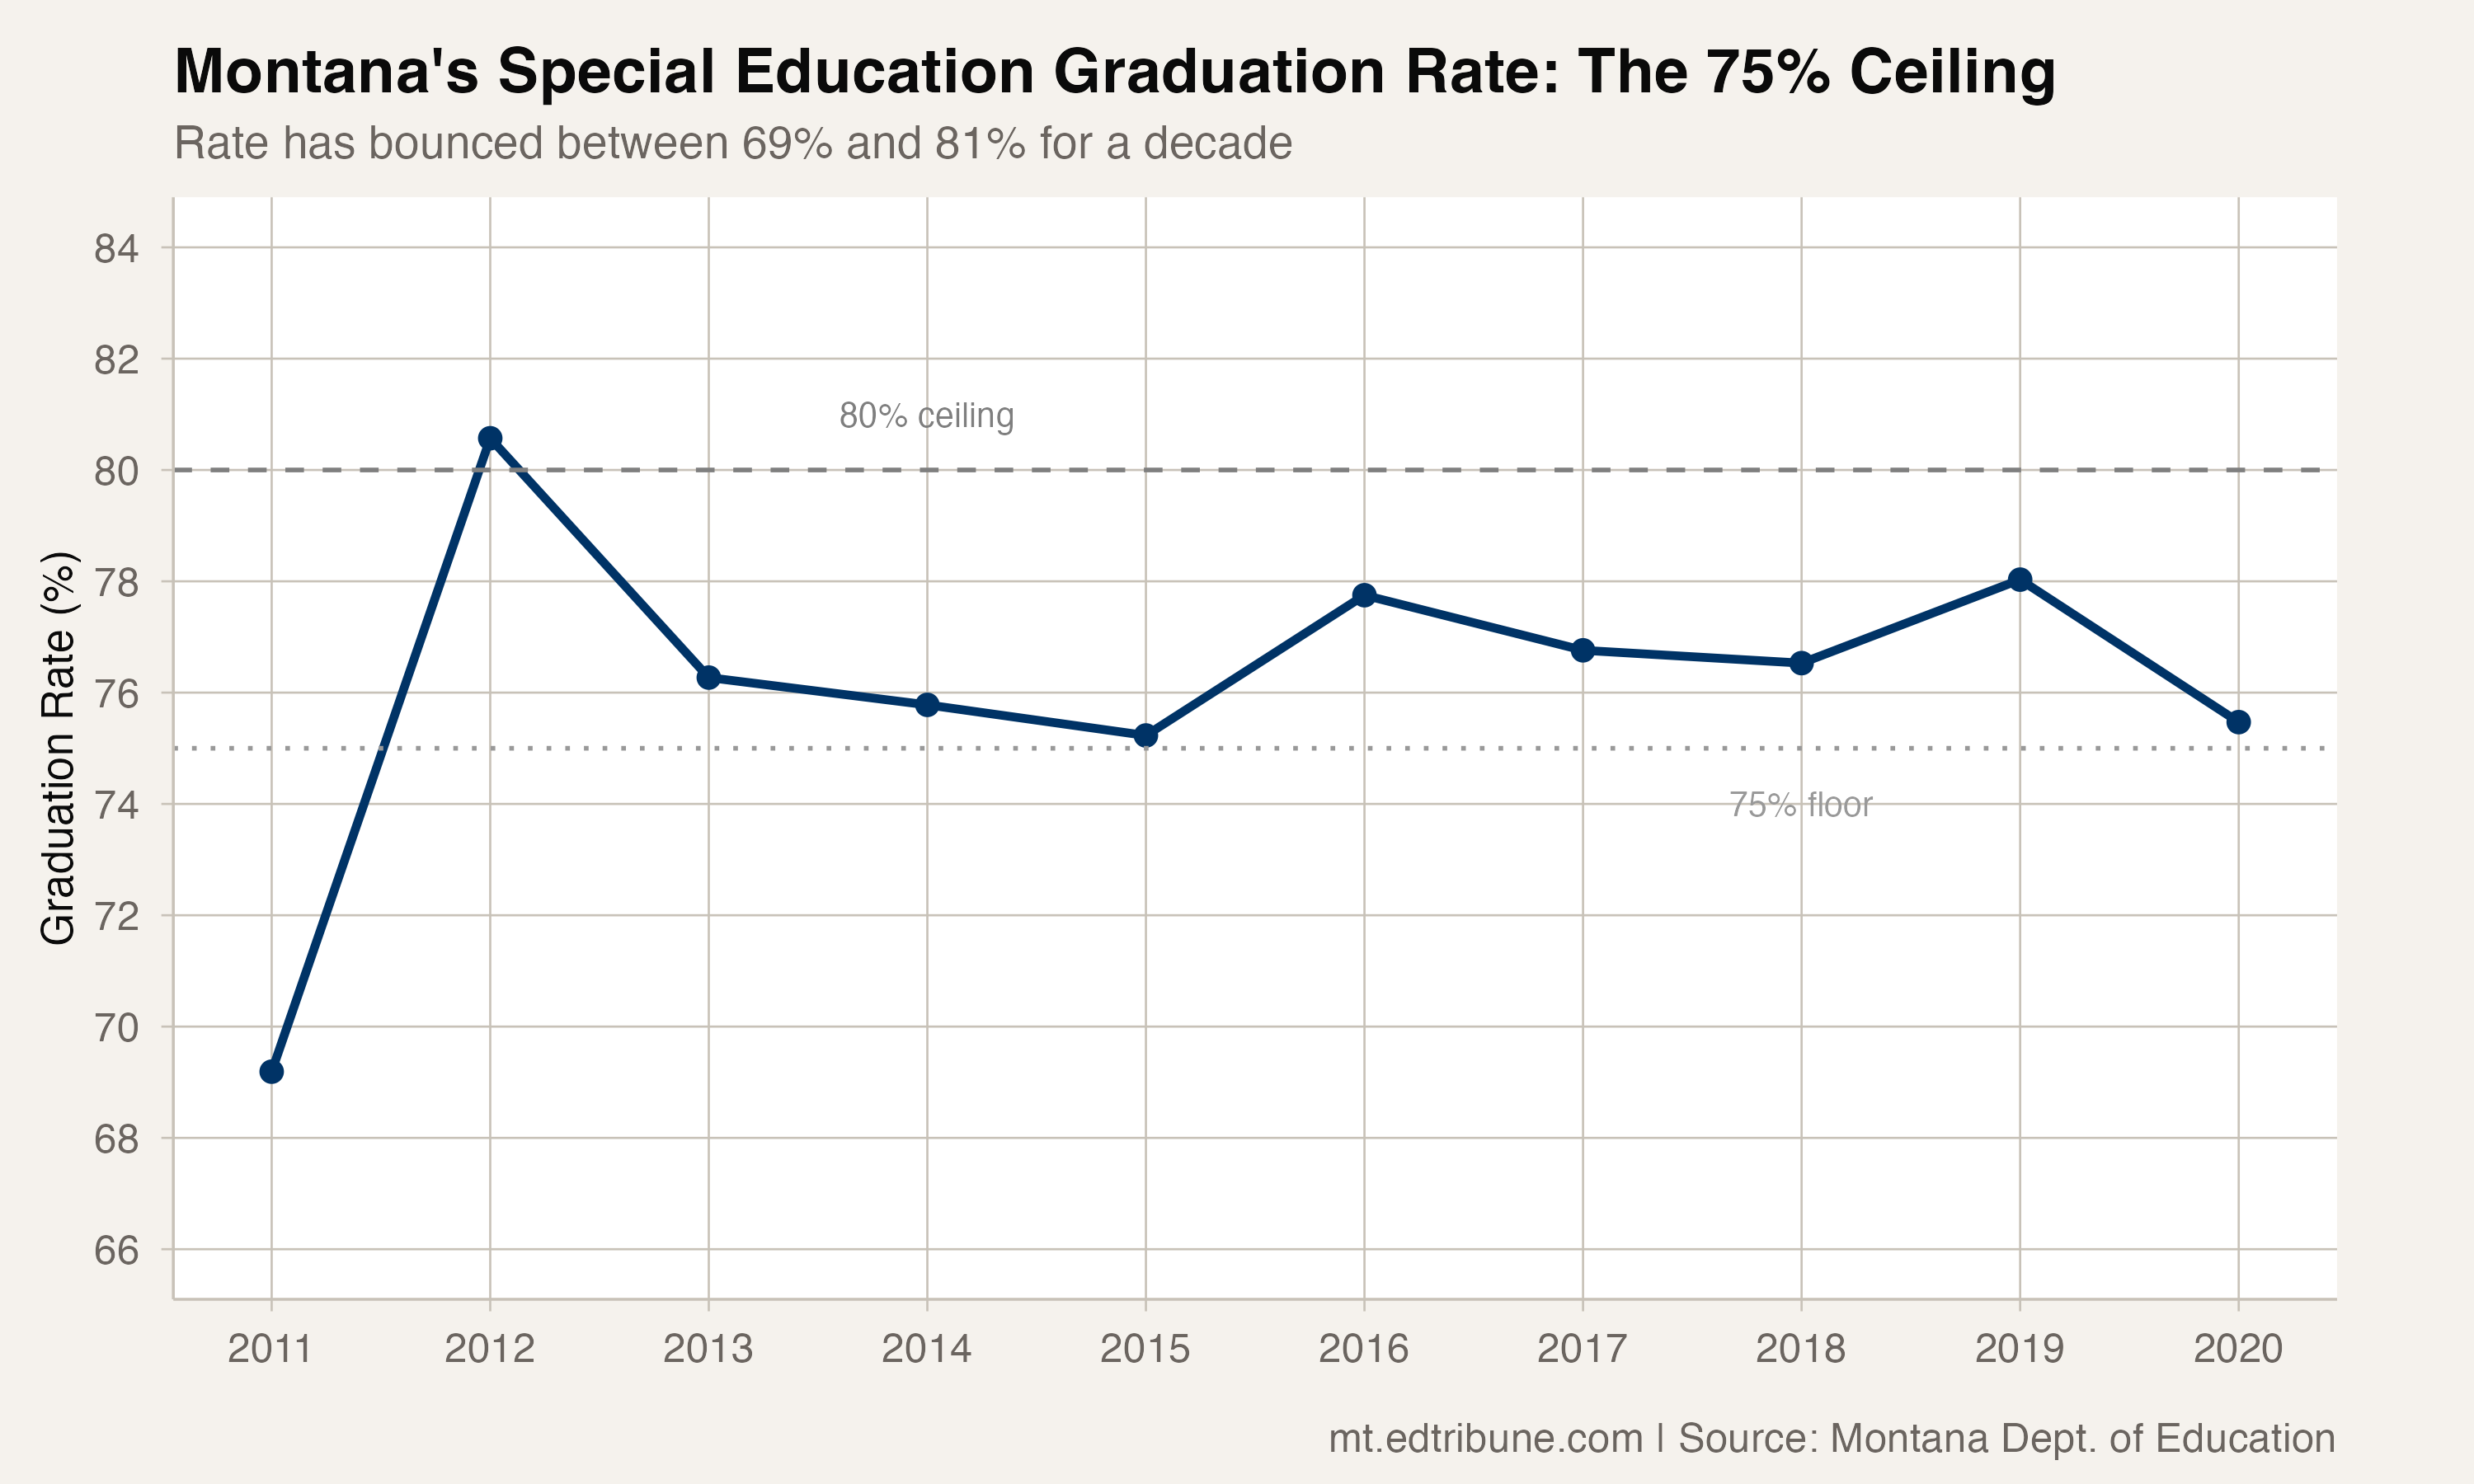
The pattern is unmistakable. Since 2013, Montana's special education graduation rate has been stuck in a band between 75% and 78%, with occasional outliers. The 2012 spike to 80.6% -- the only year the rate exceeded 80% -- looks anomalous against every other year in the data.
The ceiling at roughly 75-76% is not unique to Montana. The national four-year graduation rate for students with disabilities was 71% in 2021-22, according to the National Center for Education Statistics, the most recent year NCES reports by disability status. Montana is doing slightly better than average. But "slightly better than average" means one in four students with disabilities in Montana does not receive a diploma within four years.
The gap that won't close
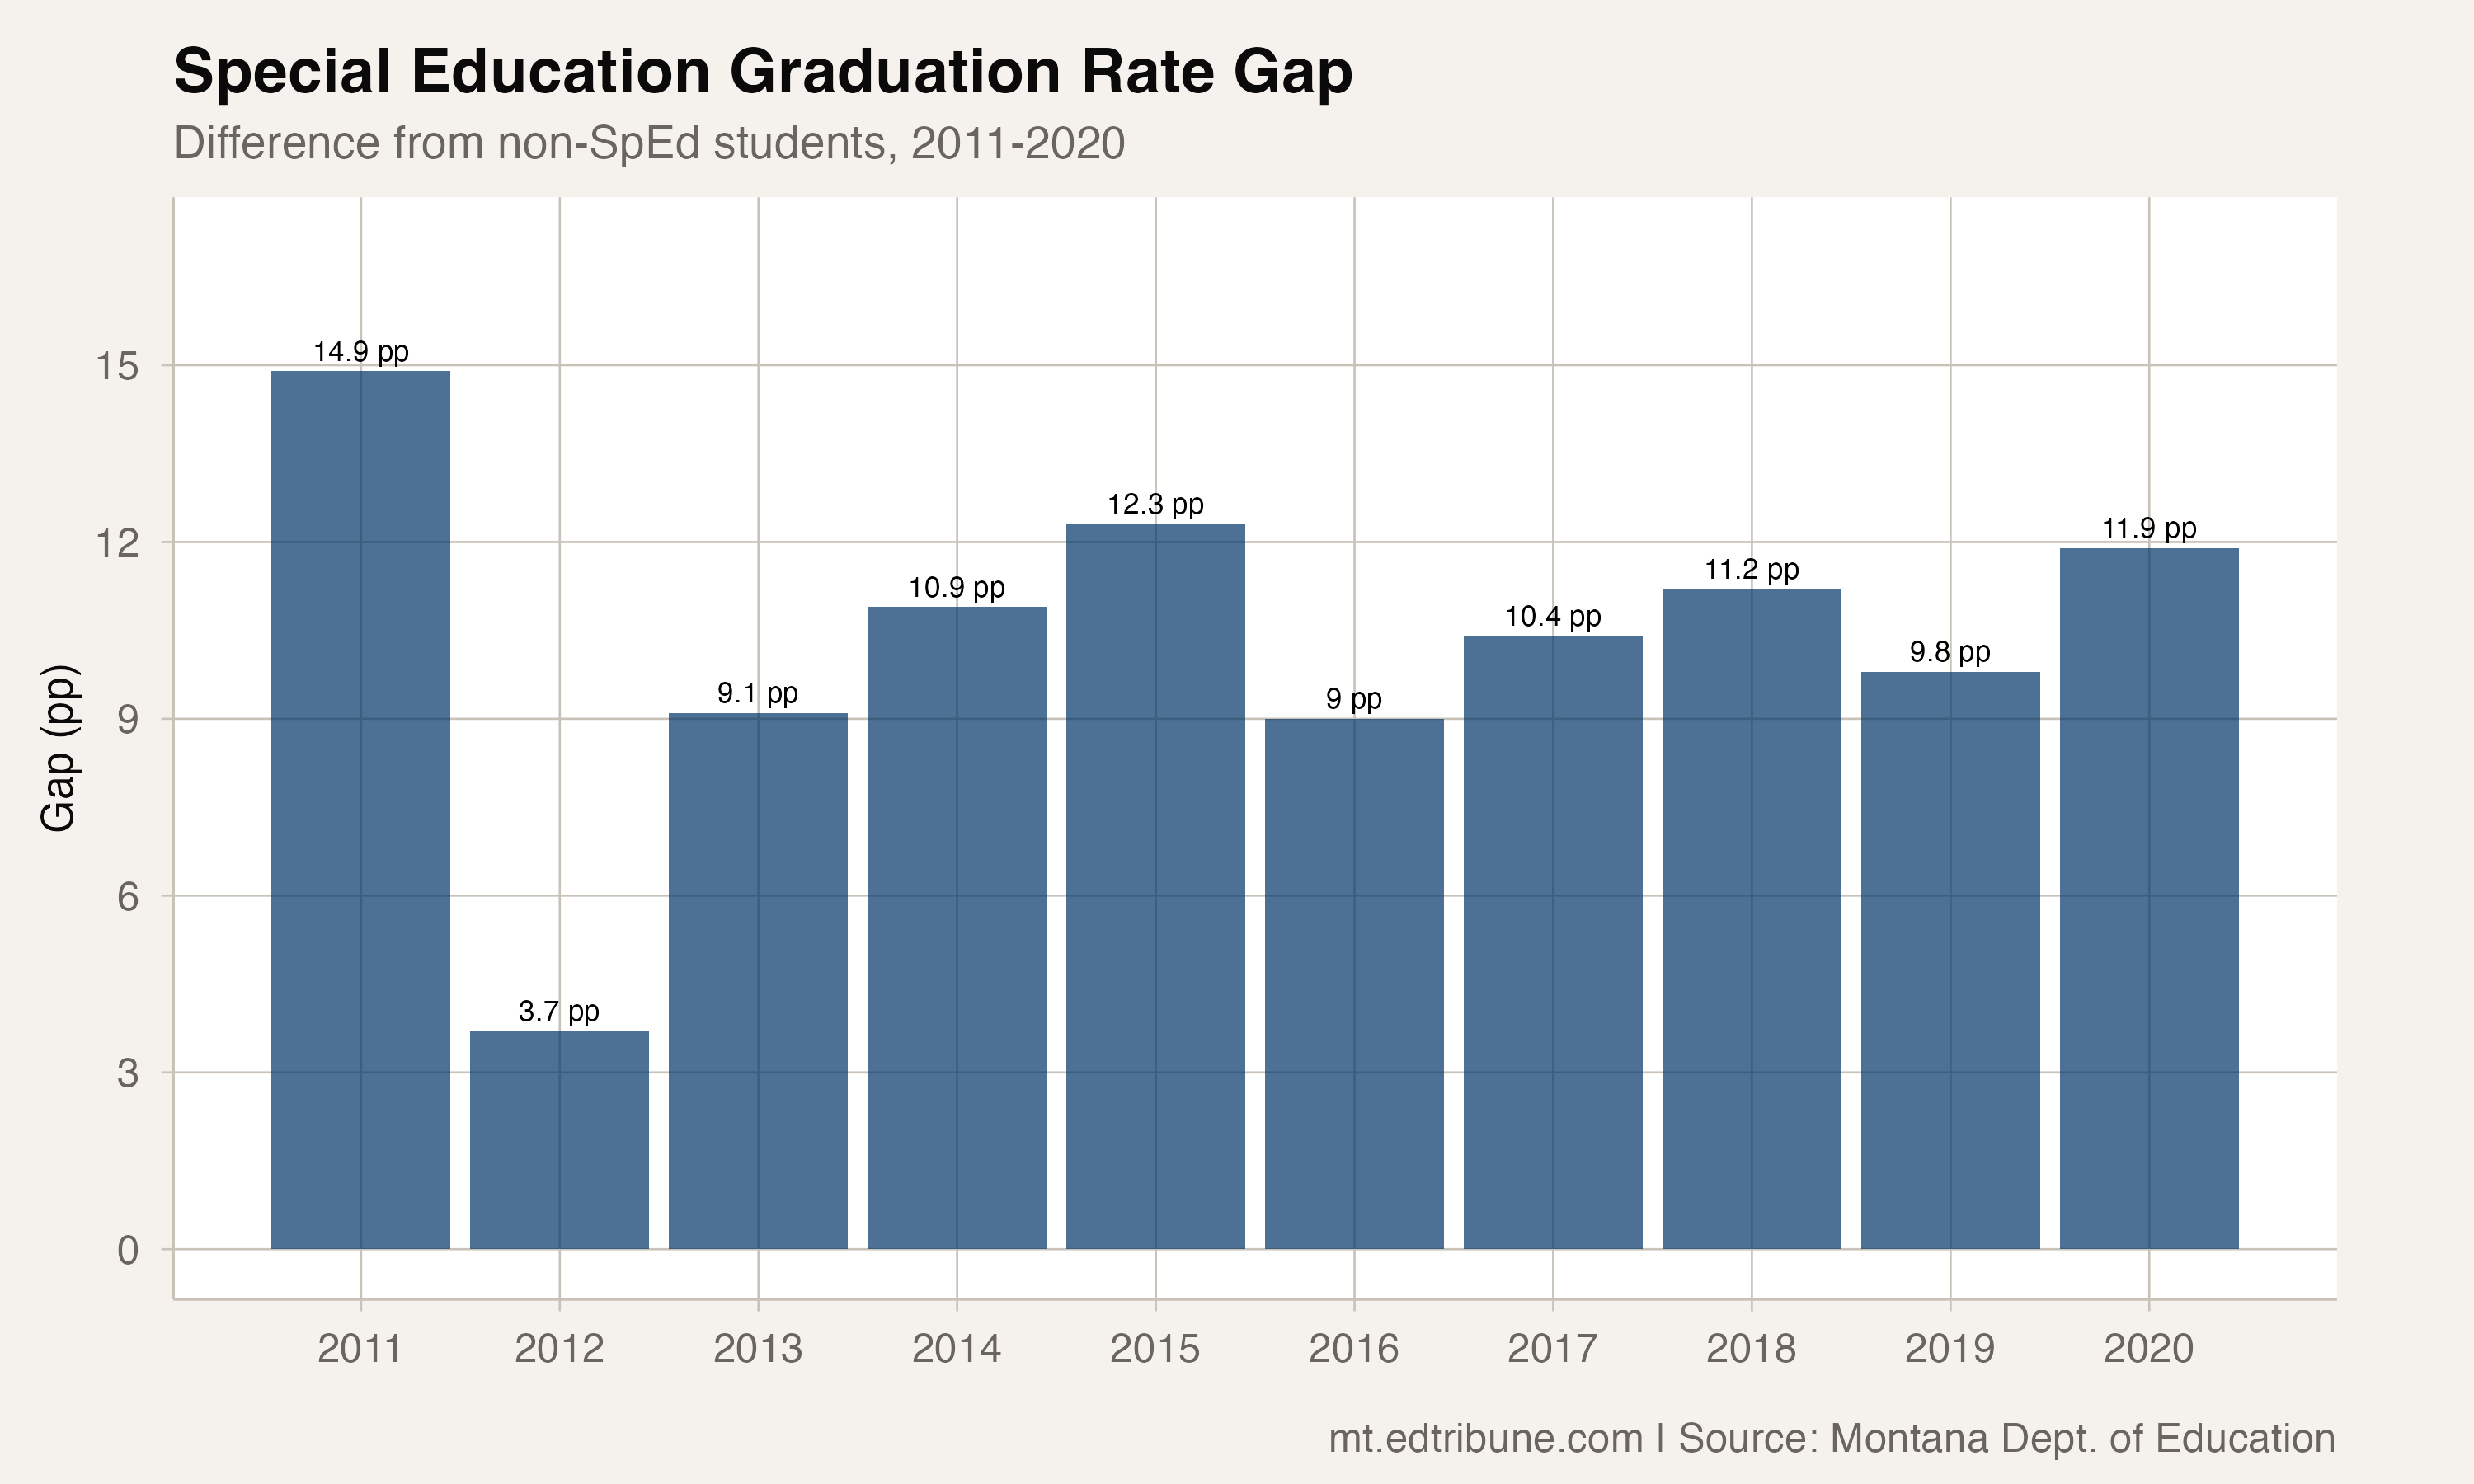
The distance between special education and non-special education students has been fairly stable since 2012. The gap was at its widest in 2011, at 14.9 points (69.2% vs 84.0%). It reached 12.3 points in 2015 (75.2% vs 87.5%), its widest in any year after 2011, and stood at 11.9 points in 2020 (75.5% vs 87.4%).
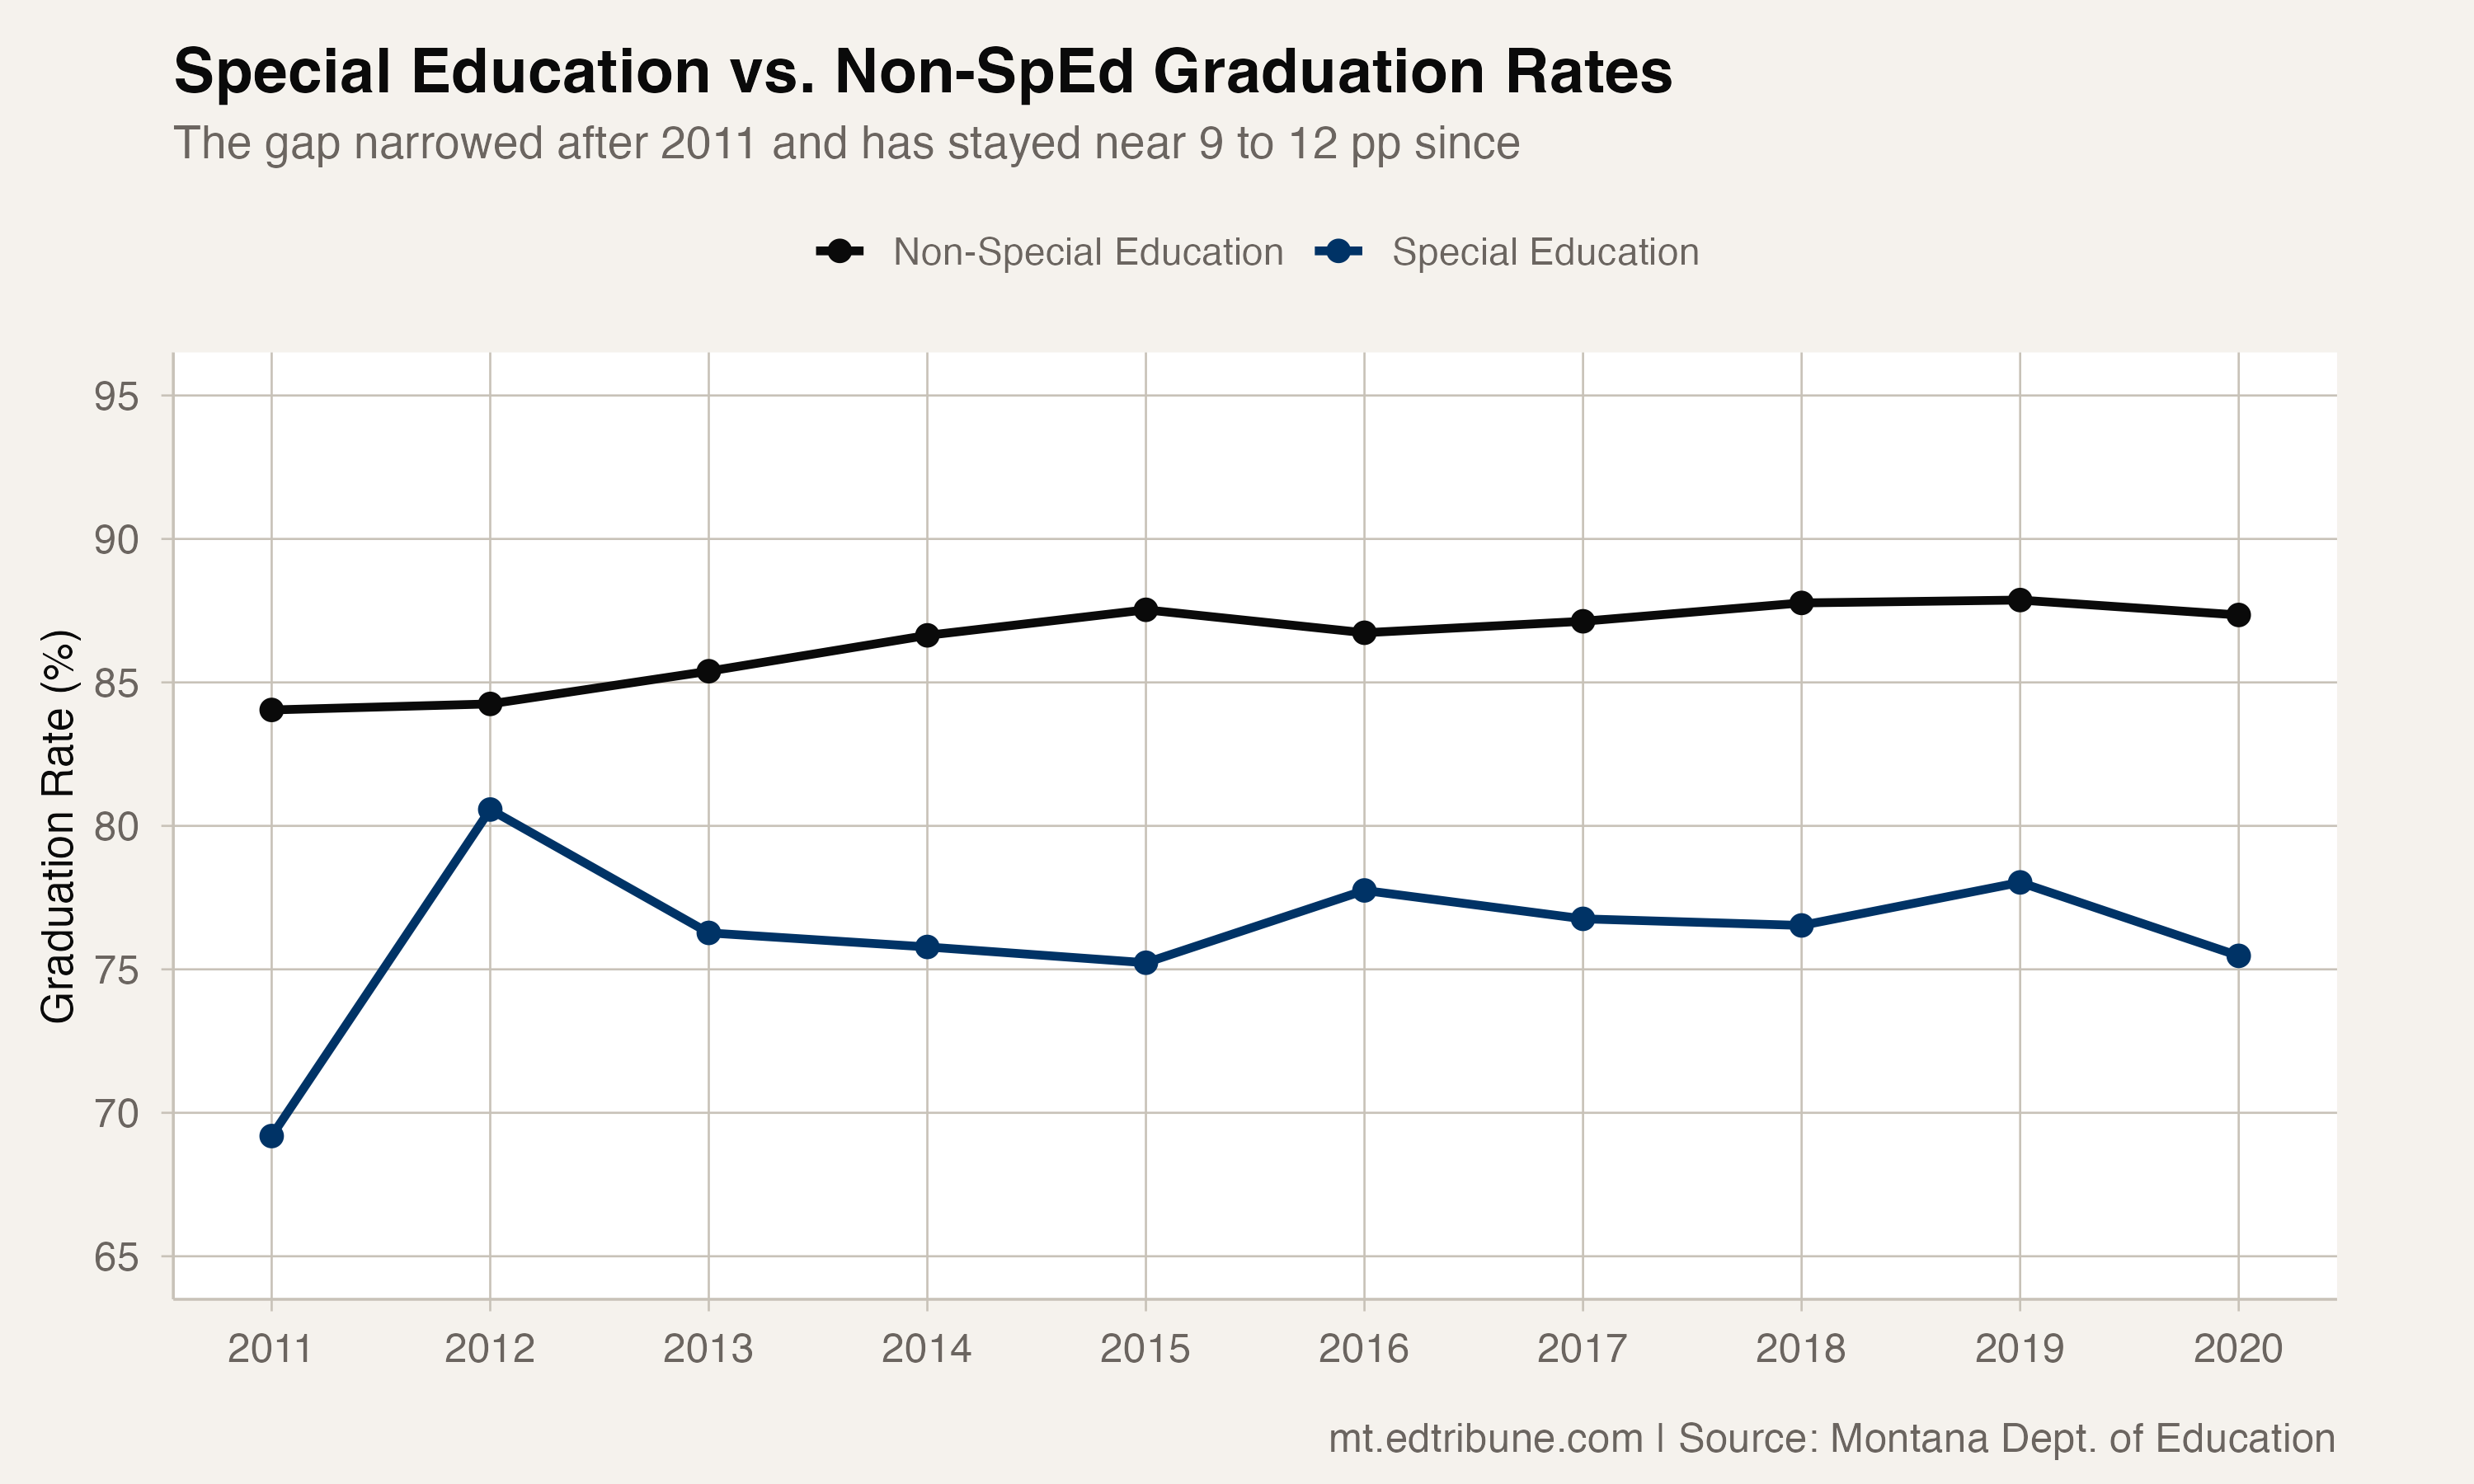
The gap appears to have narrowed slightly -- from roughly 15 points to roughly 12 points. But that narrowing is mostly an artifact of the non-special-education rate plateauing in the high 80s while the special education rate climbed from its 2011 low. Since 2015, neither rate has moved much, and the gap has stayed at roughly 9 to 12 points.
What 75% means for students
A 75% graduation rate means that for every four students receiving special education services who enter ninth grade, one does not earn a diploma within four years. Some of those students may take additional time, and the four-year cohort rate is the only measure in this series, so the eventual completion rate is not visible in the data. Others may exit to alternative credentials, GEDs, or without any credential at all.
The implications are financial as well as educational. Adults without a high school diploma earn significantly less over their lifetime and are far more likely to depend on public assistance. For individuals with disabilities, who already face employment barriers, the absence of a diploma compounds existing disadvantages.
The improvement that wasn't enough
Special education students did improve over the decade. The 6.3-point gain from 2011 to 2020 ranks third among all subgroups, behind only English Learners (+8.9) and Native American students (+6.4). Montana's special education graduation system is not static -- it has produced meaningful gains.
But the gains have not been sustained year to year. The rate goes up by 2 points, then gives back 2 points. The 2012 spike (80.6%) was followed immediately by a 4-point drop to 76.3%. The 2019 high of 78.0% was followed by a drop to 75.5% in 2020.
This volatility may reflect the relatively small size of the special education cohort at the state level. Small cohort sizes amplify year-to-year variation. But the persistence of the pattern -- bouncing around 76% for a decade -- suggests something more structural than statistical noise.
Transition planning and the four-year clock
The four-year graduation rate is a particularly imperfect measure for special education students. Under IDEA, students with disabilities are entitled to services through age 21, and many IEPs include transition plans that anticipate a fifth or sixth year of high school. For students pursuing modified diplomas or alternative pathways, the four-year clock may not reflect the timeline their education was designed around.
The four-year cohort series does not carry an extended-year rate that would capture these students. The 75% rate may understate the eventual completion rate for special education students by a significant margin -- but without that data, it remains an assumption, not a measurement.
What the data stops showing
Like other subgroups, the special education line in Montana's four-year cohort graduation series ends in 2020. The state's graduation releases for 2021 through 2024 report the statewide rate and, in most years, American Indian students, without a special education breakout. Whether the pandemic disrupted special education graduation patterns -- through interrupted services, reduced access to therapies, or challenges with remote IEP implementation -- is unknown from the available data.
National data suggests that students with disabilities were disproportionately affected by pandemic-era school closures. If Montana followed the national pattern, the special education rate may have declined further since 2020, potentially dropping below the 75% floor for the first time since 2011.
The decade of data that is available tells a consistent story: Montana graduates about three in four special education students on time, has done so for roughly ten years, and shows no evidence of breaking through to a higher level.
Analysis uses four-year adjusted cohort graduation rate data from the Montana Office of Public Instruction. Special education subgroup data covers 2011-2020. National comparison from the National Center for Education Statistics, 2021-22.
Detailed code that reproduces the analysis and figures in this article is available exclusively to EdTribune subscribers.
Discussion
Sign in to join the discussion.
Loading comments...