Correction (July 20, 2026): An earlier version treated incomplete subgroup series as current, included an unverified American Indian dropout statistic, and overstated what those data could prove about reaching 90%. The statewide graduation-rate series and its three-year decline are unchanged.
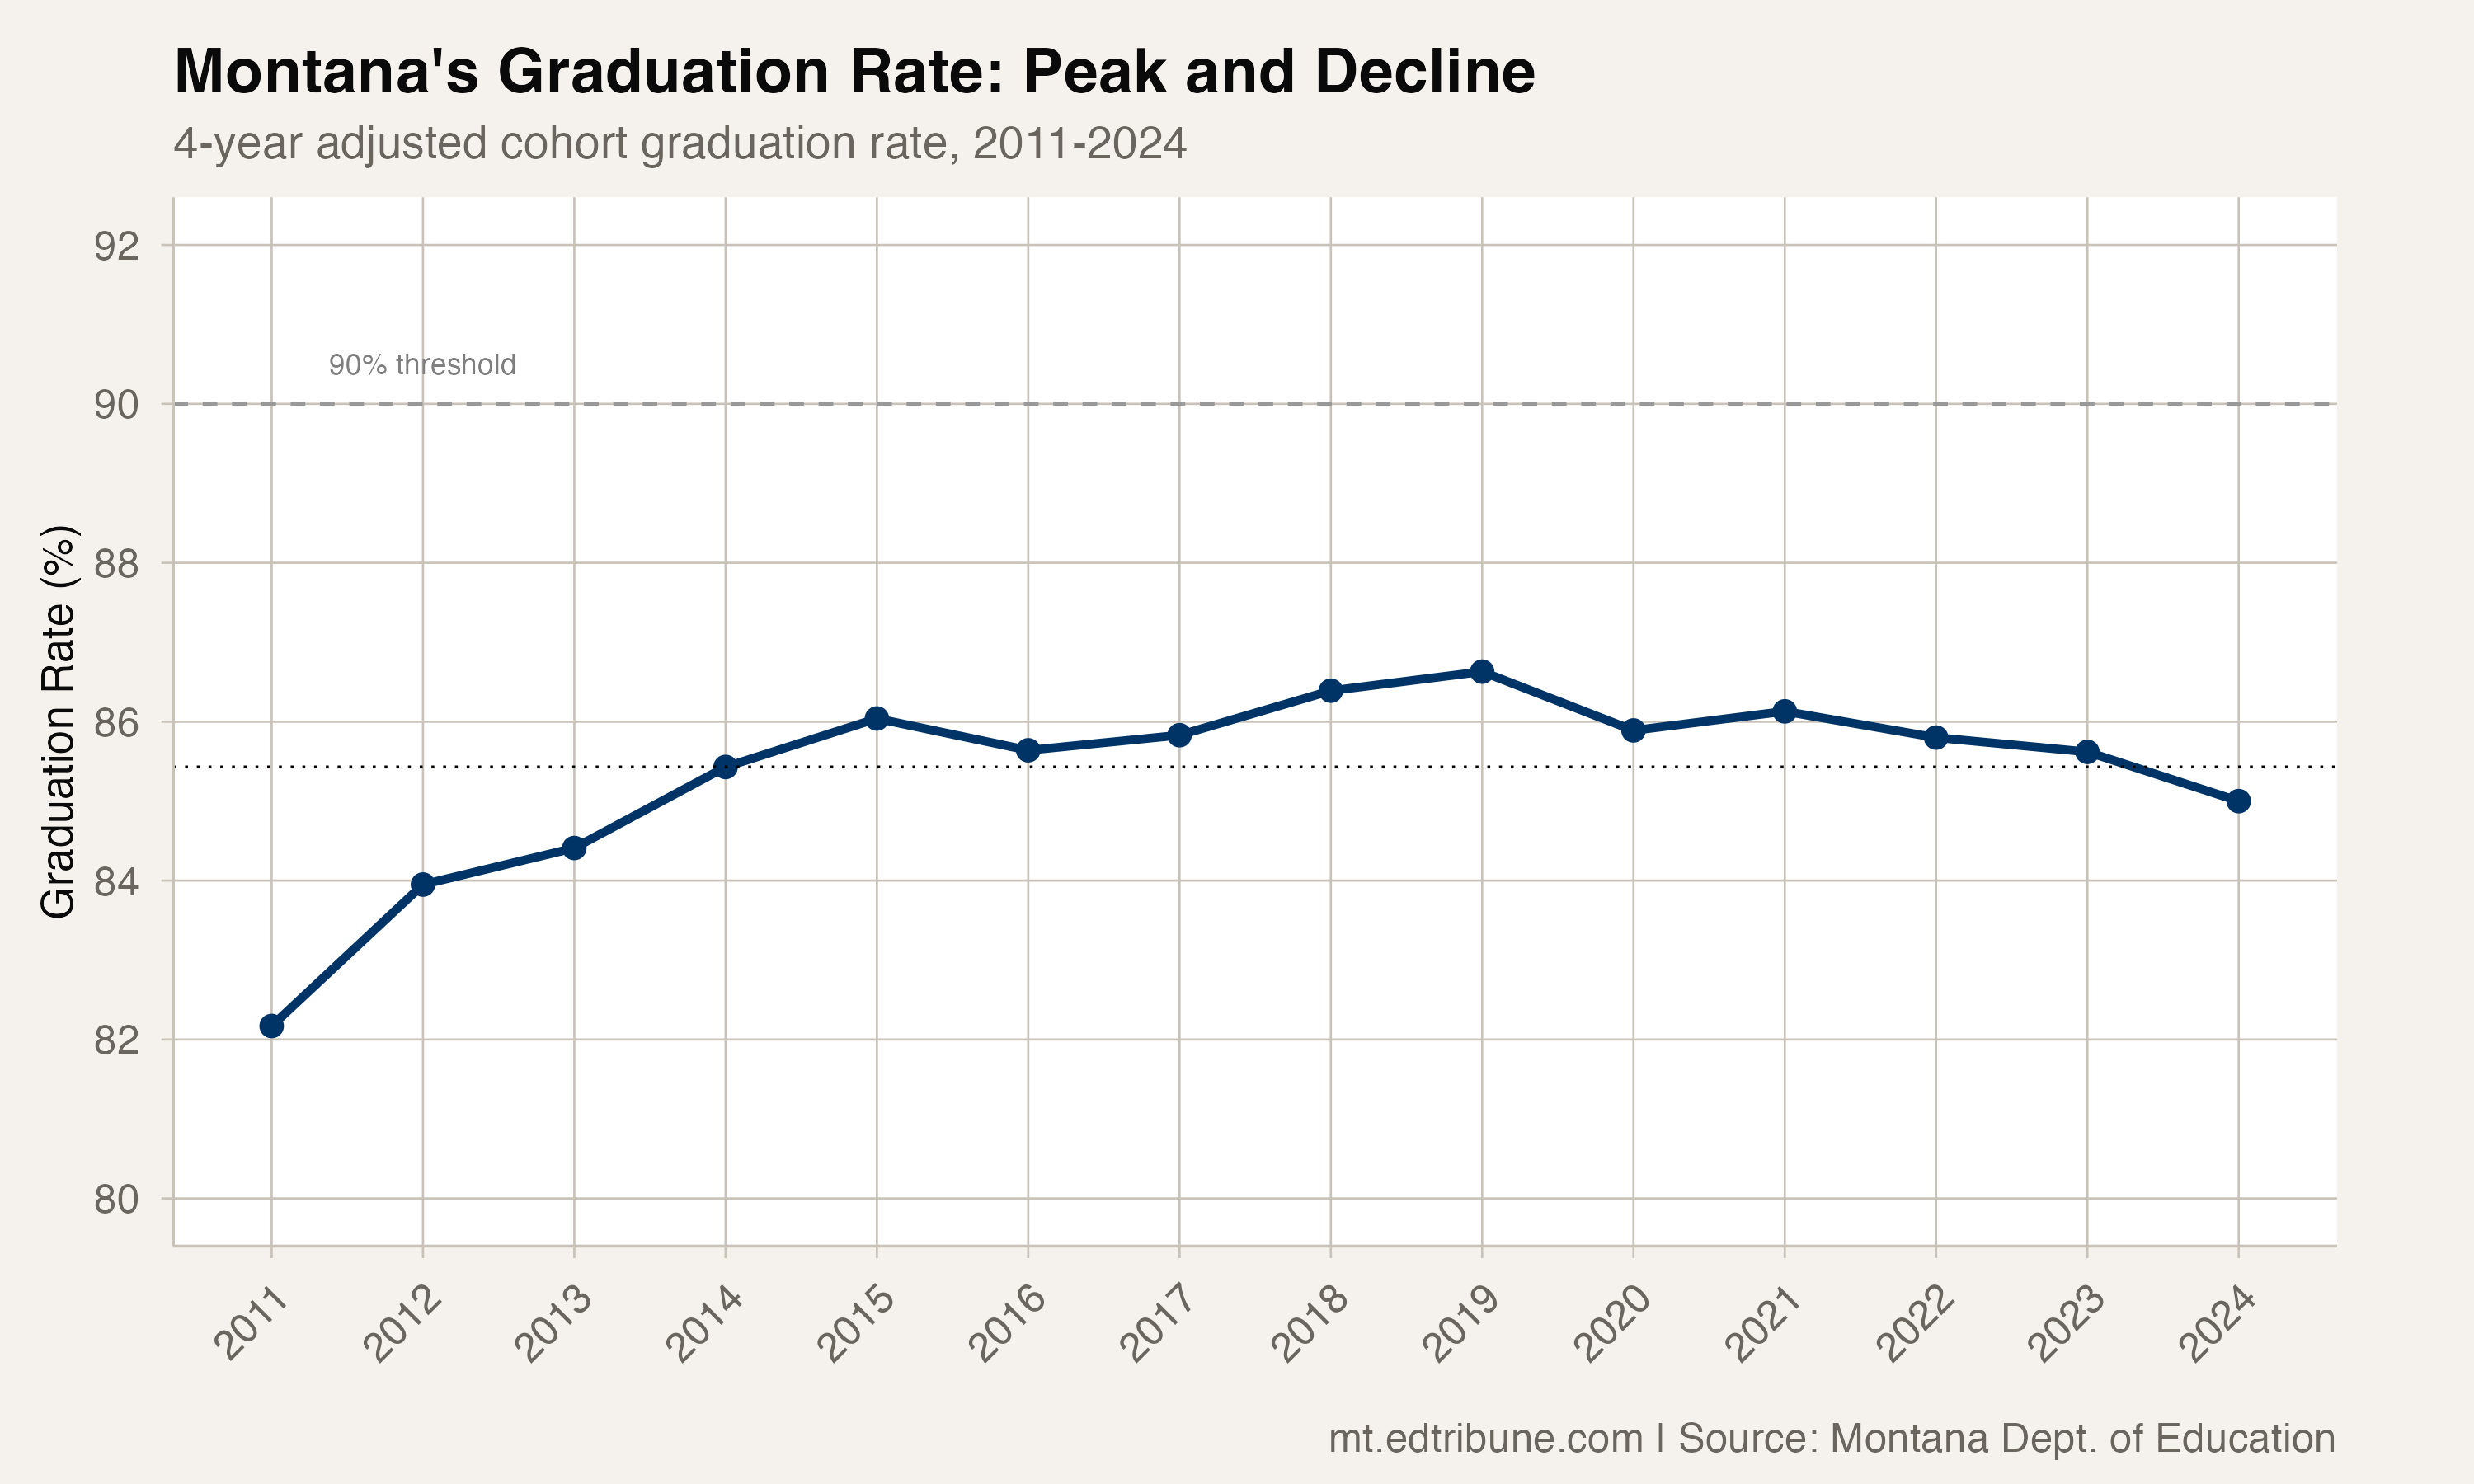
Montana's four-year graduation rate peaked at 86.6% in 2019. Five years later, it has fallen to 85.0% -- below where it stood in 2014, when the state was still in the middle of its most sustained period of improvement.
Three consecutive years of decline, from 2022 through 2024, have reversed roughly 40% of the gains Montana made during its 2011-2015 surge. The trajectory is pointed in the wrong direction, and the 90% graduation threshold is now 5 points above the latest rate.
Four eras of Montana graduation
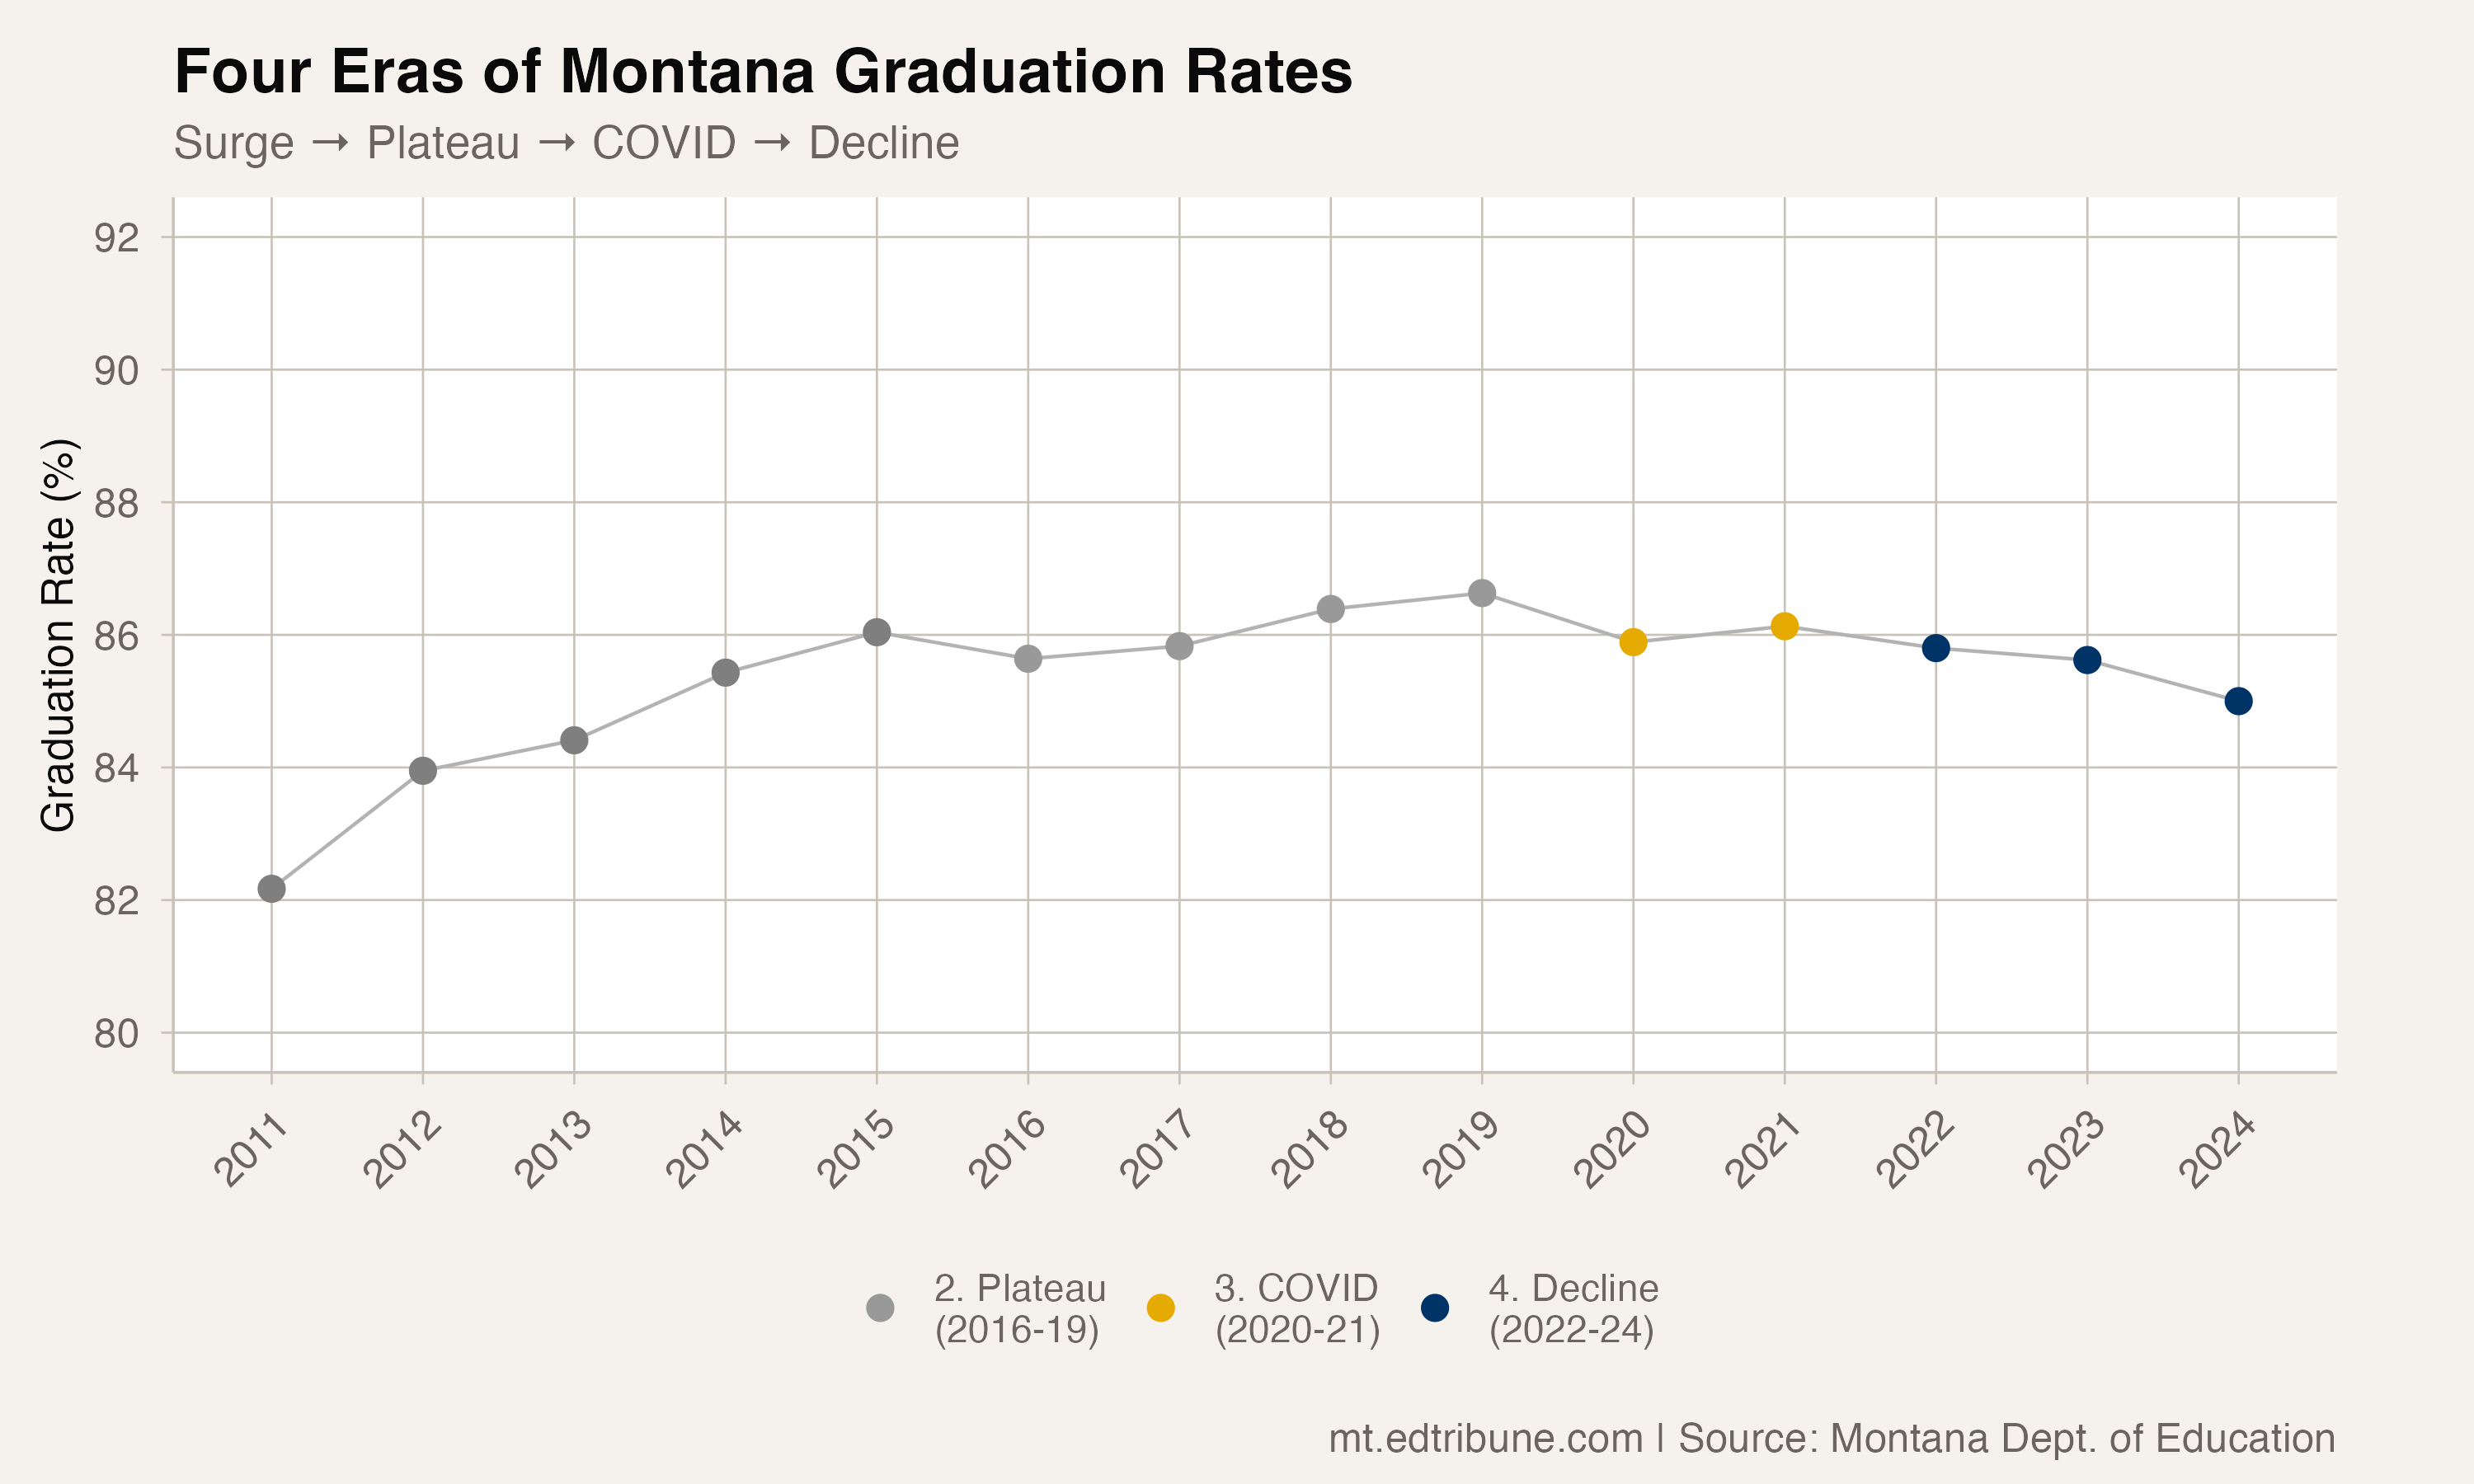
The 14-year data record breaks into four distinct periods, each with its own story.
The surge (2011-2015): Montana's graduation rate climbed from 82.2% to 86.0%, gaining nearly 4 percentage points in four years. The graduation series establishes the improvement but does not identify its causes.
The plateau (2016-2019): The rate flattened, oscillating between 85.6% and 86.6%. Montana was making marginal gains -- a few tenths of a point here and there -- but the momentum from the surge years had stalled.
The COVID disruption (2020-2021): The rate dipped to 85.9% in 2020 before recovering to 86.1% in 2021. The pandemic impact on graduation was surprisingly mild at the state level, though subgroup-level data tells a different story.
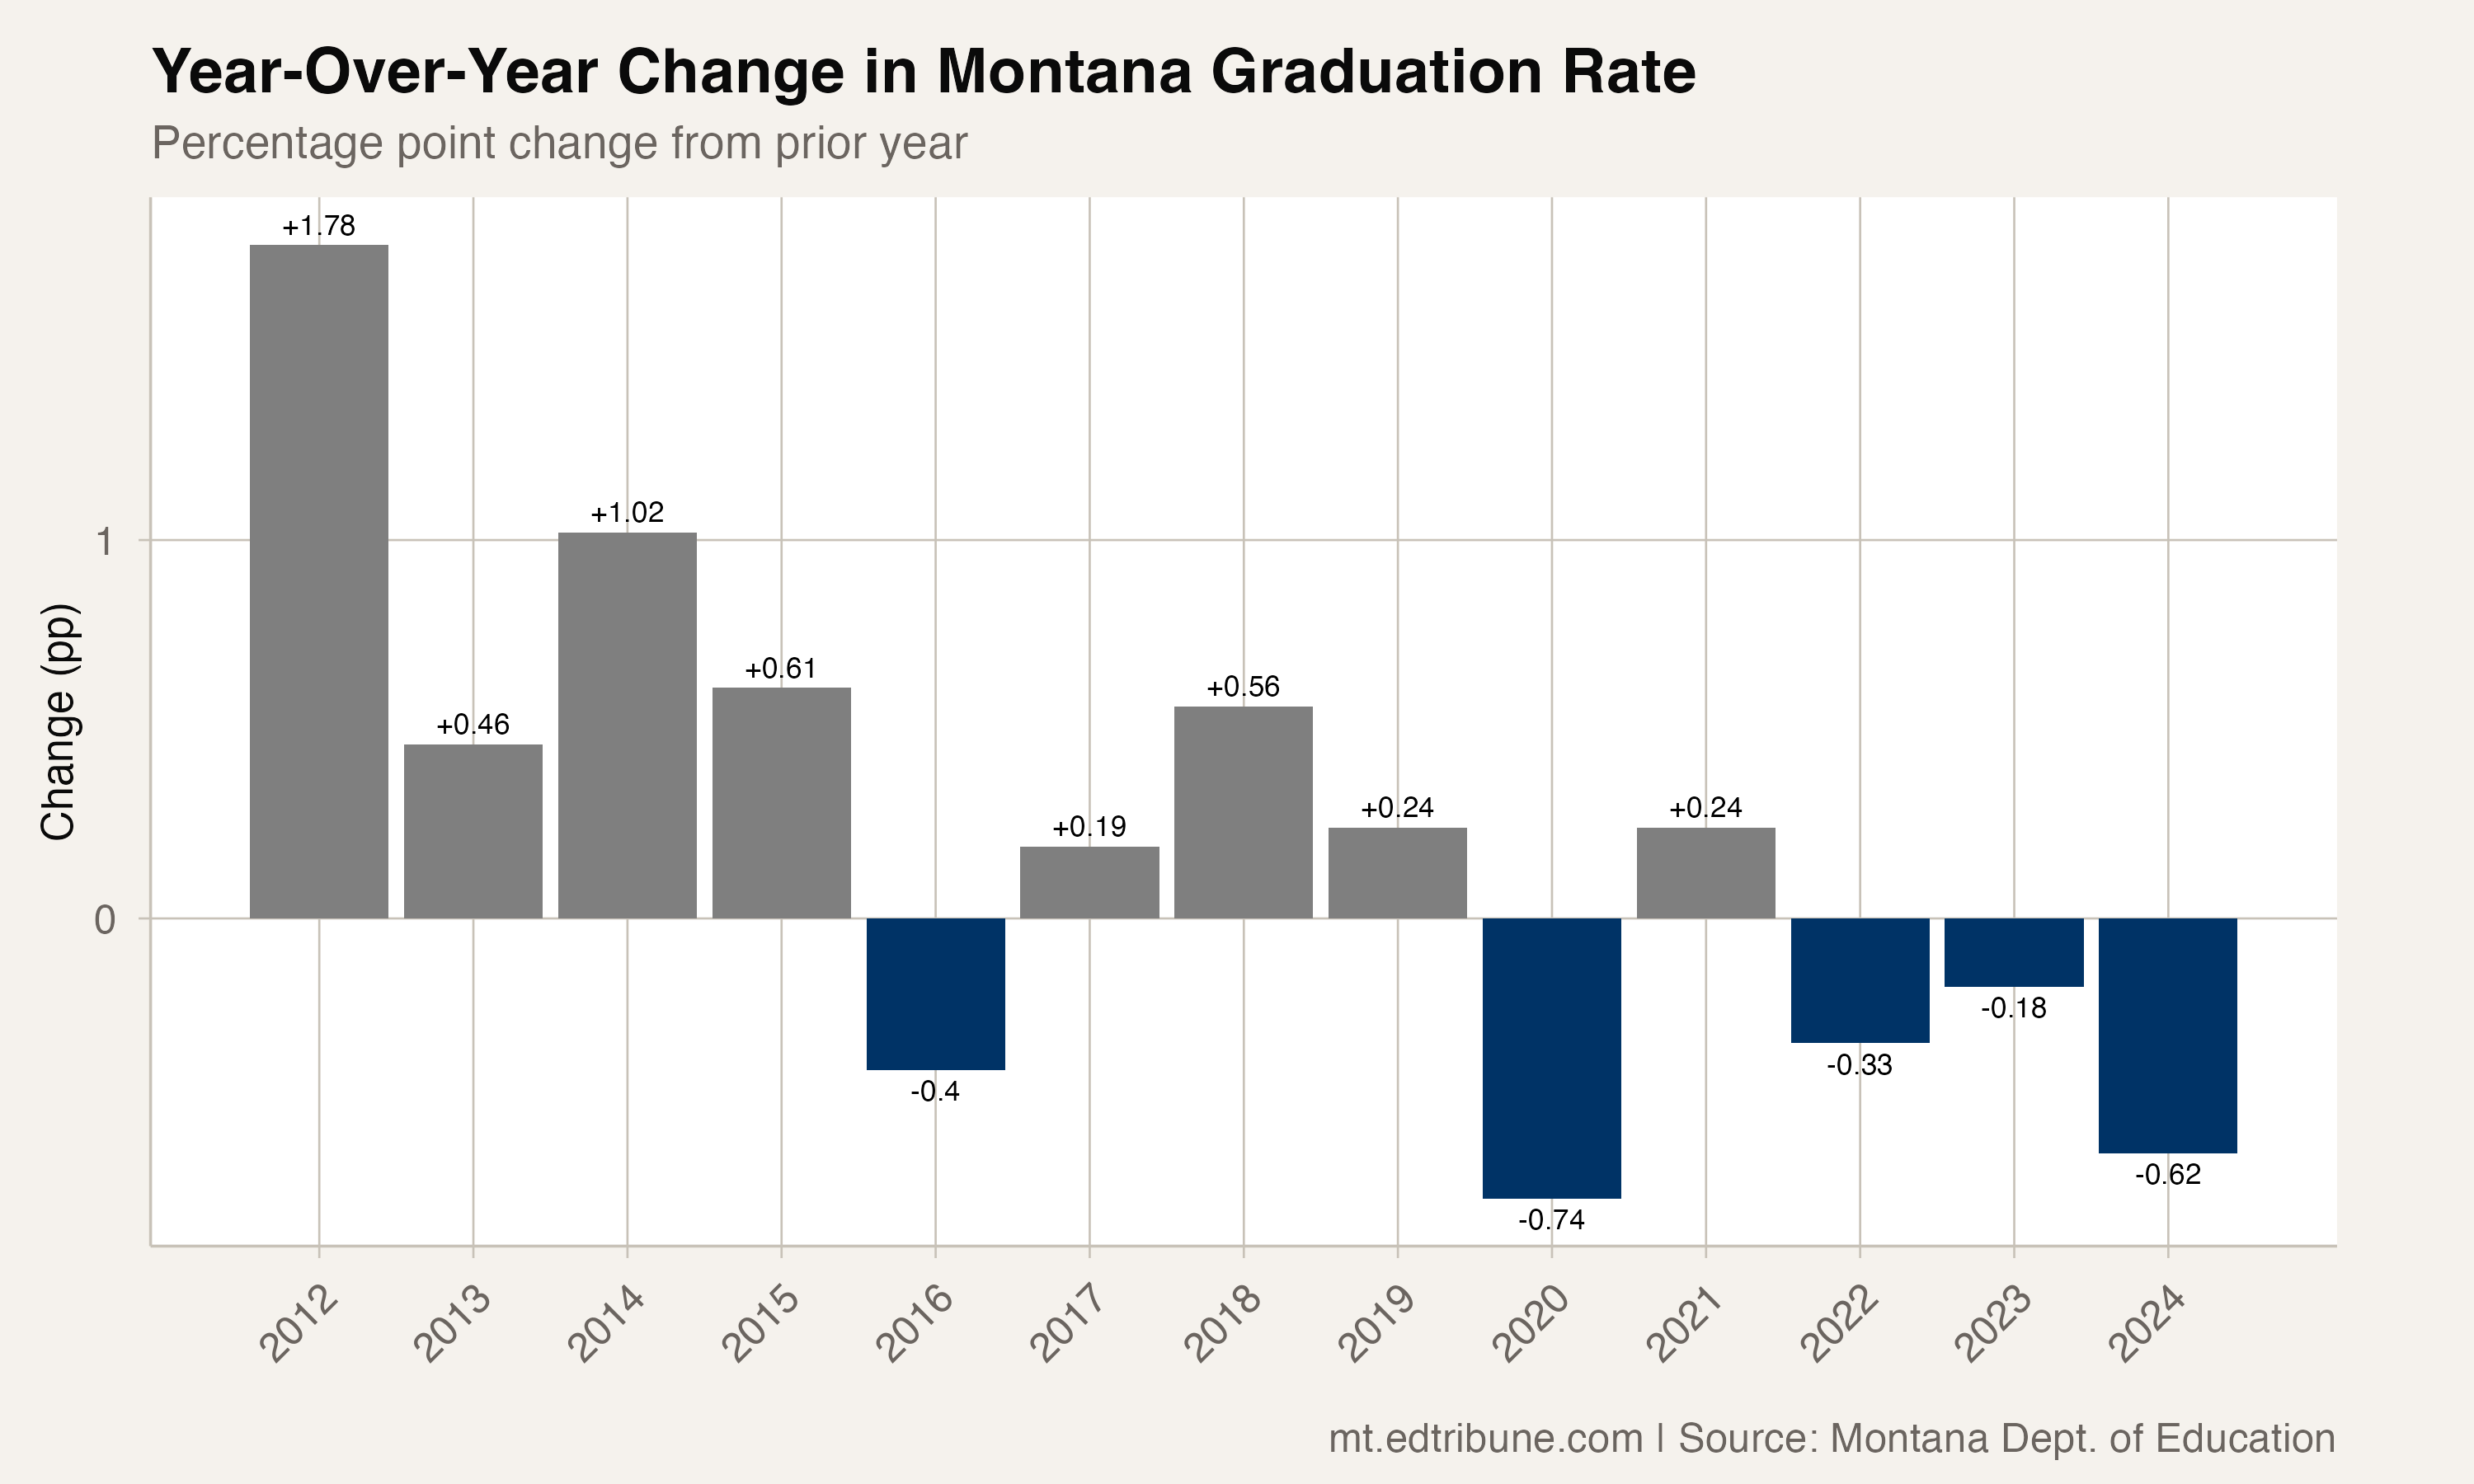
The decline (2022-2024): Three straight years of erosion -- down 0.33 points, then 0.18, then 0.62. The 2024 drop of 0.62 points was the largest single-year decline since 2020.
The 2024 drop was the steepest in years
Year-over-year changes in graduation rates are typically small -- measured in tenths of a percentage point. Montana's 0.62-point drop in 2024 was the largest non-COVID decline in the data record and roughly three times the magnitude of the 2022 and 2023 losses.
The cumulative decline from peak to current stands at 1.63 percentage points. That may sound modest, but it represents a reversal of roughly 40% of the gains Montana made during the 2011-2015 surge. A straight-line extension of the last three annual changes, which averaged a 0.38-point decline, would put the rate below 84% by 2027; that is an illustration, not a forecast.
Why 90% is further away than ever
When Montana was climbing in the early 2010s, the 90% threshold was a plausible aspiration. The non-economically-disadvantaged student rate had already exceeded 93% by 2014, proving that Montana schools could produce graduation rates well above 90% for students without economic barriers.
But the overall rate has never come closer than 3.4 points to 90%. The available subgroup series also document large gaps, though they end in different years: Native American students were at 66.1% in 2023, while English learners were at 65.4% and economically disadvantaged students at 76.8% in 2020. Those incomplete series cannot establish that 90% is mathematically or structurally out of reach.
Below 2014 -- and below the nation
At 85.0%, Montana now sits approximately 2 percentage points below the national four-year adjusted cohort graduation rate of 87% in 2021-22. The comparison uses different reporting years and is context, not a same-year ranking.
The 2014 comparison is particularly pointed. In that year, Montana was on the upswing -- posting 85.4% on the way to its eventual peak. A decade later, the rate has slipped below that mark from the other direction, on the way down.
What reversed the momentum
The data alone cannot explain why Montana's graduation rate stopped climbing and started falling. But several structural factors are visible in the numbers:
The Native American graduation rate, after peaking at 69.2% in 2021, dropped 3.1 points to 66.1% by 2023. That decline coincided with the statewide slide, but the aggregate data do not establish how much it contributed.
The economically disadvantaged rate peaked at 78.0% in 2018 and has not been measured since 2020 due to limited subgroup data availability. If it has followed the same downward trajectory as the overall rate, that would compound the decline.
Montana's special education graduation rate reached 78.0% in 2019 and fell to 75.5% in 2020, the latest year available for that subgroup in the package.
Montana rode a wave of improvement from 2012 to 2015 that made 90% look plausible. A decade later, the state is further from that mark than when the push began. The graduation data show when the trend changed; they do not show which interventions drove either the earlier gains or the later reversal.
Analysis uses four-year adjusted cohort graduation rate data from the Montana Office of Public Instruction, covering 2011-2024. The national comparison comes from NCES for 2021-22.
Detailed code that reproduces the analysis and figures in this article is available exclusively to EdTribune subscribers.
Discussion
Sign in to join the discussion.
Loading comments...