In the 14 years of four-year adjusted cohort data Montana has published, from the class of 2011 through the class of 2024, the statewide graduation rate has never reached 90%.
The highest it has been is 86.6%, with the class of 2019. The most recent published rate, for the class of 2024, is 85.0%, and it has fallen in each of the last three years. The distance to 90% is not a rounding problem. It is the arithmetic of four large groups of students who graduate well below the state average.
The proof is in the subgroups
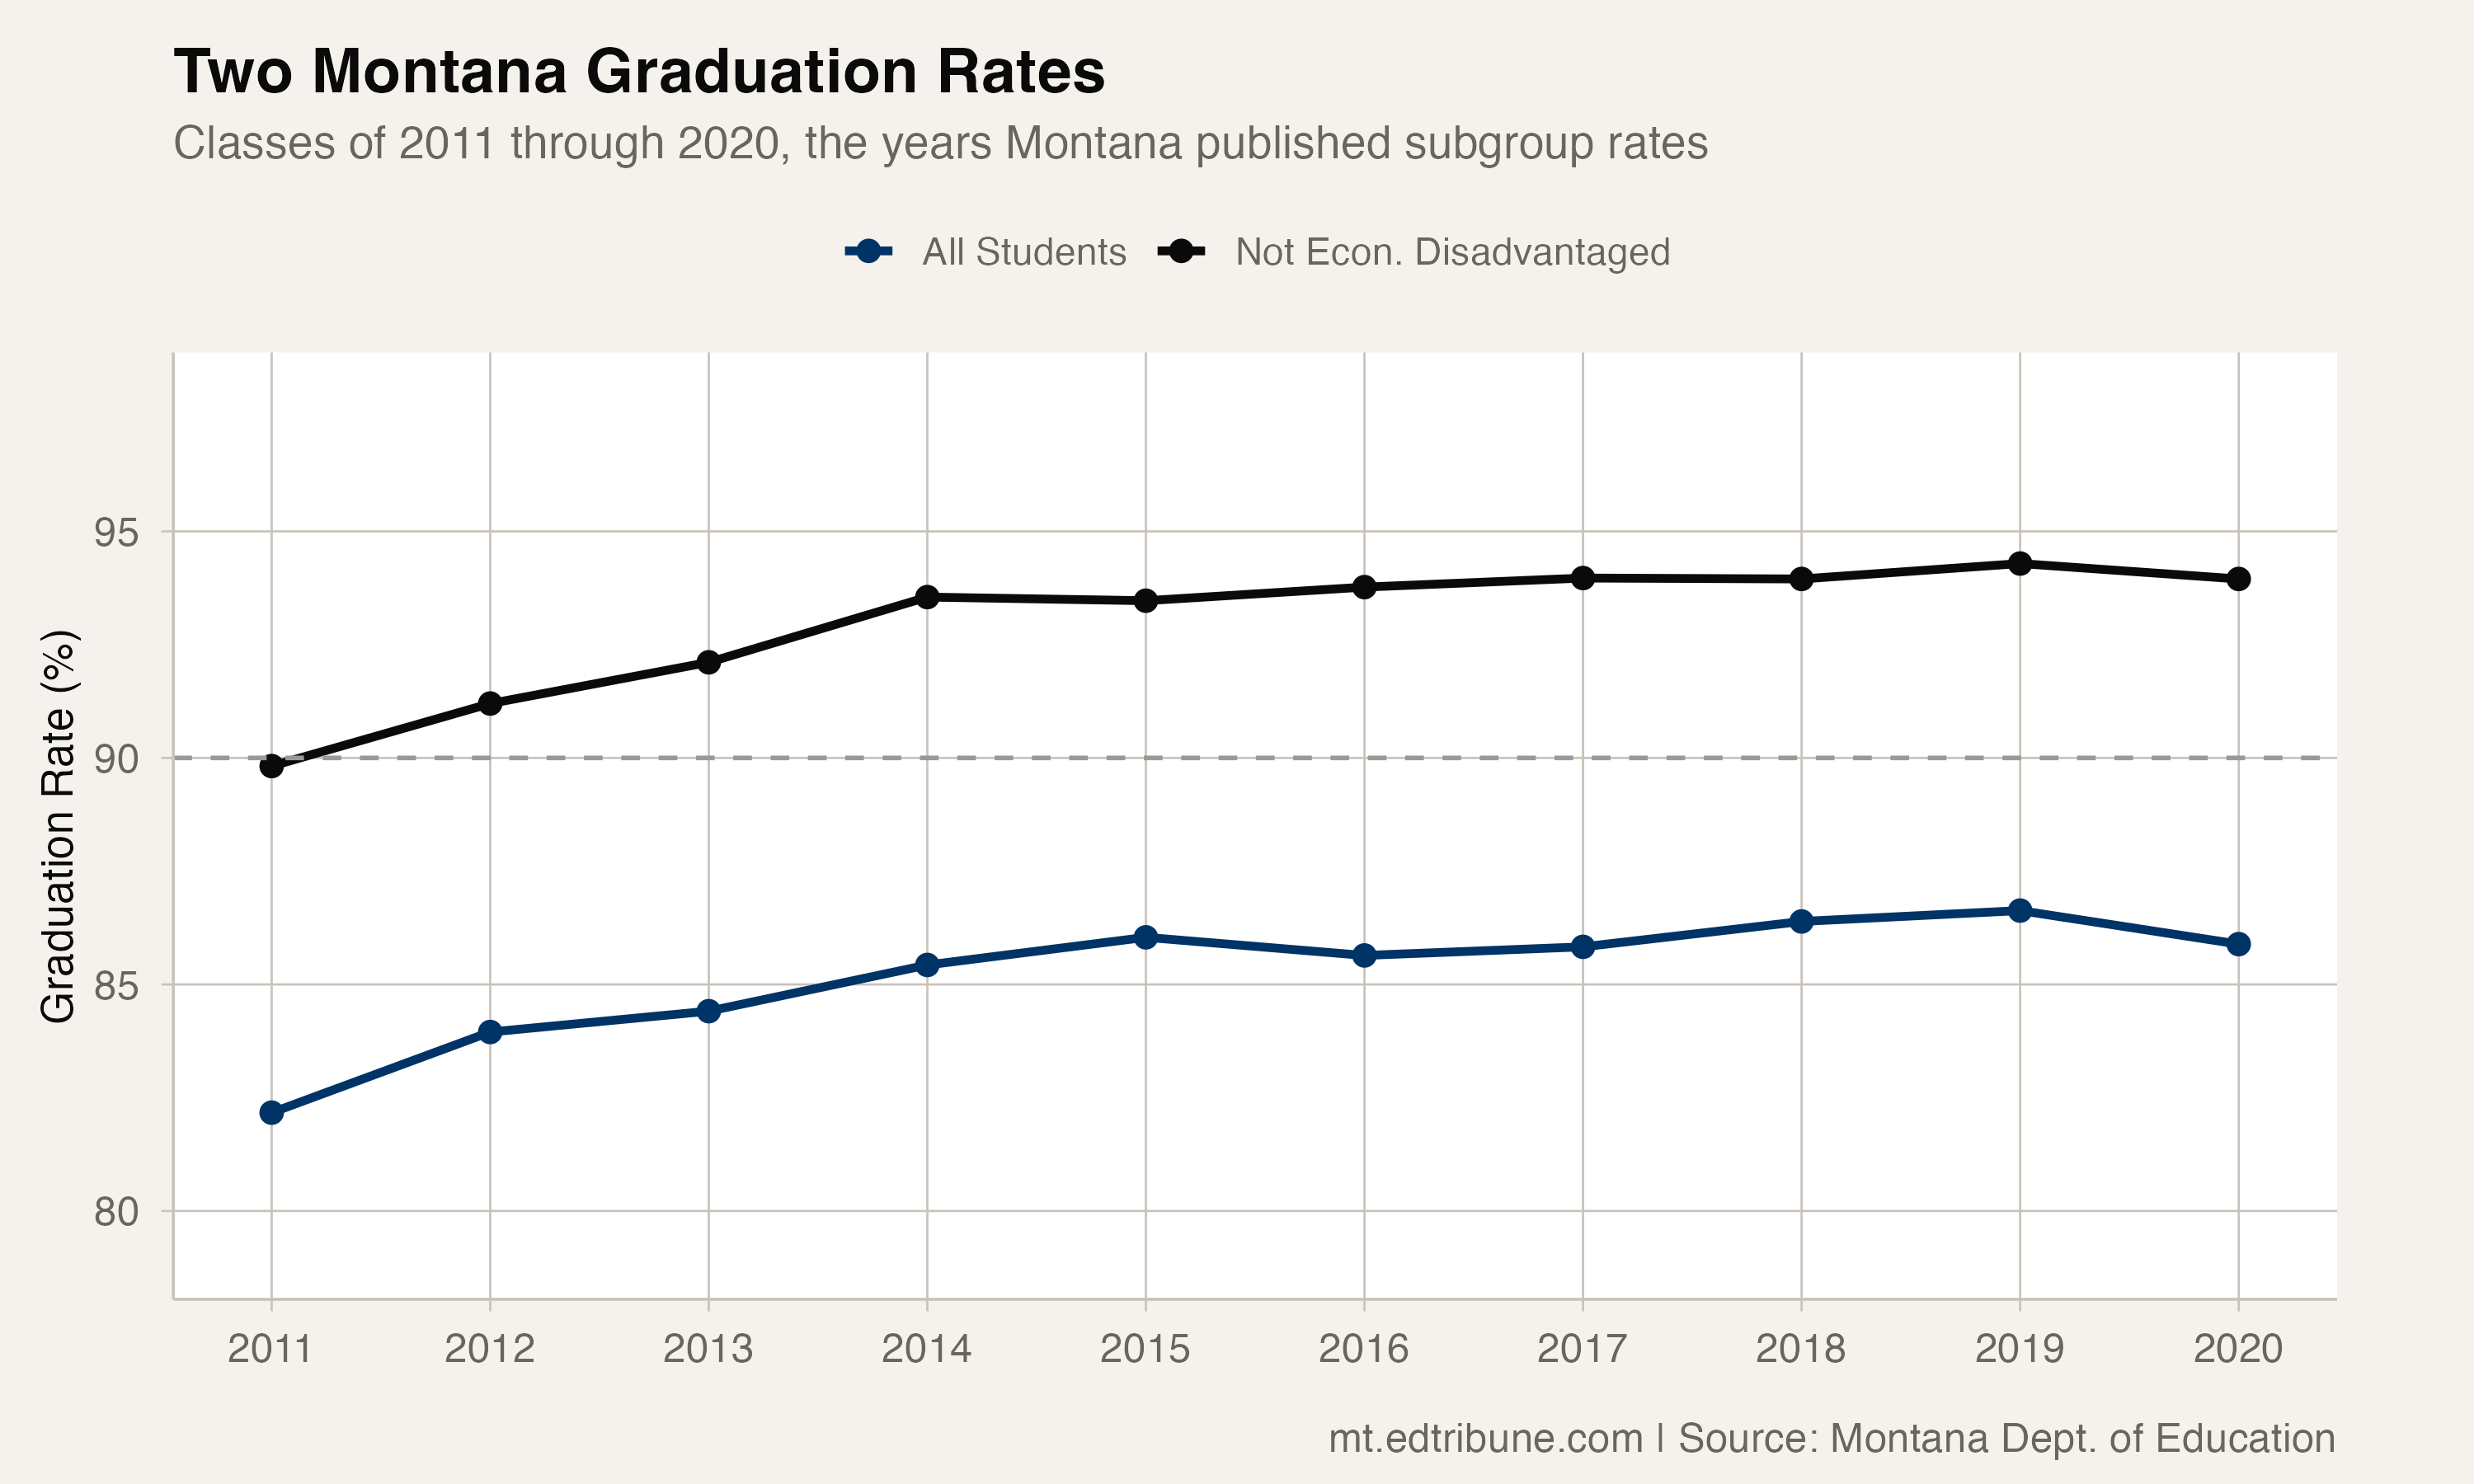
Students who are not economically disadvantaged graduated above 93% in every year from 2014 through 2020, the last year Montana published a full set of subgroup rates. The peak was 94.3%, with the class of 2019. Montana schools already produced graduation rates well above 90% for students without economic barriers.
That was not always true. In 2011, the first year of the series, even students who were not economically disadvantaged graduated at 89.8%, just under the threshold. The group cleared 90% in 2012 and stayed above it in every year through 2020.
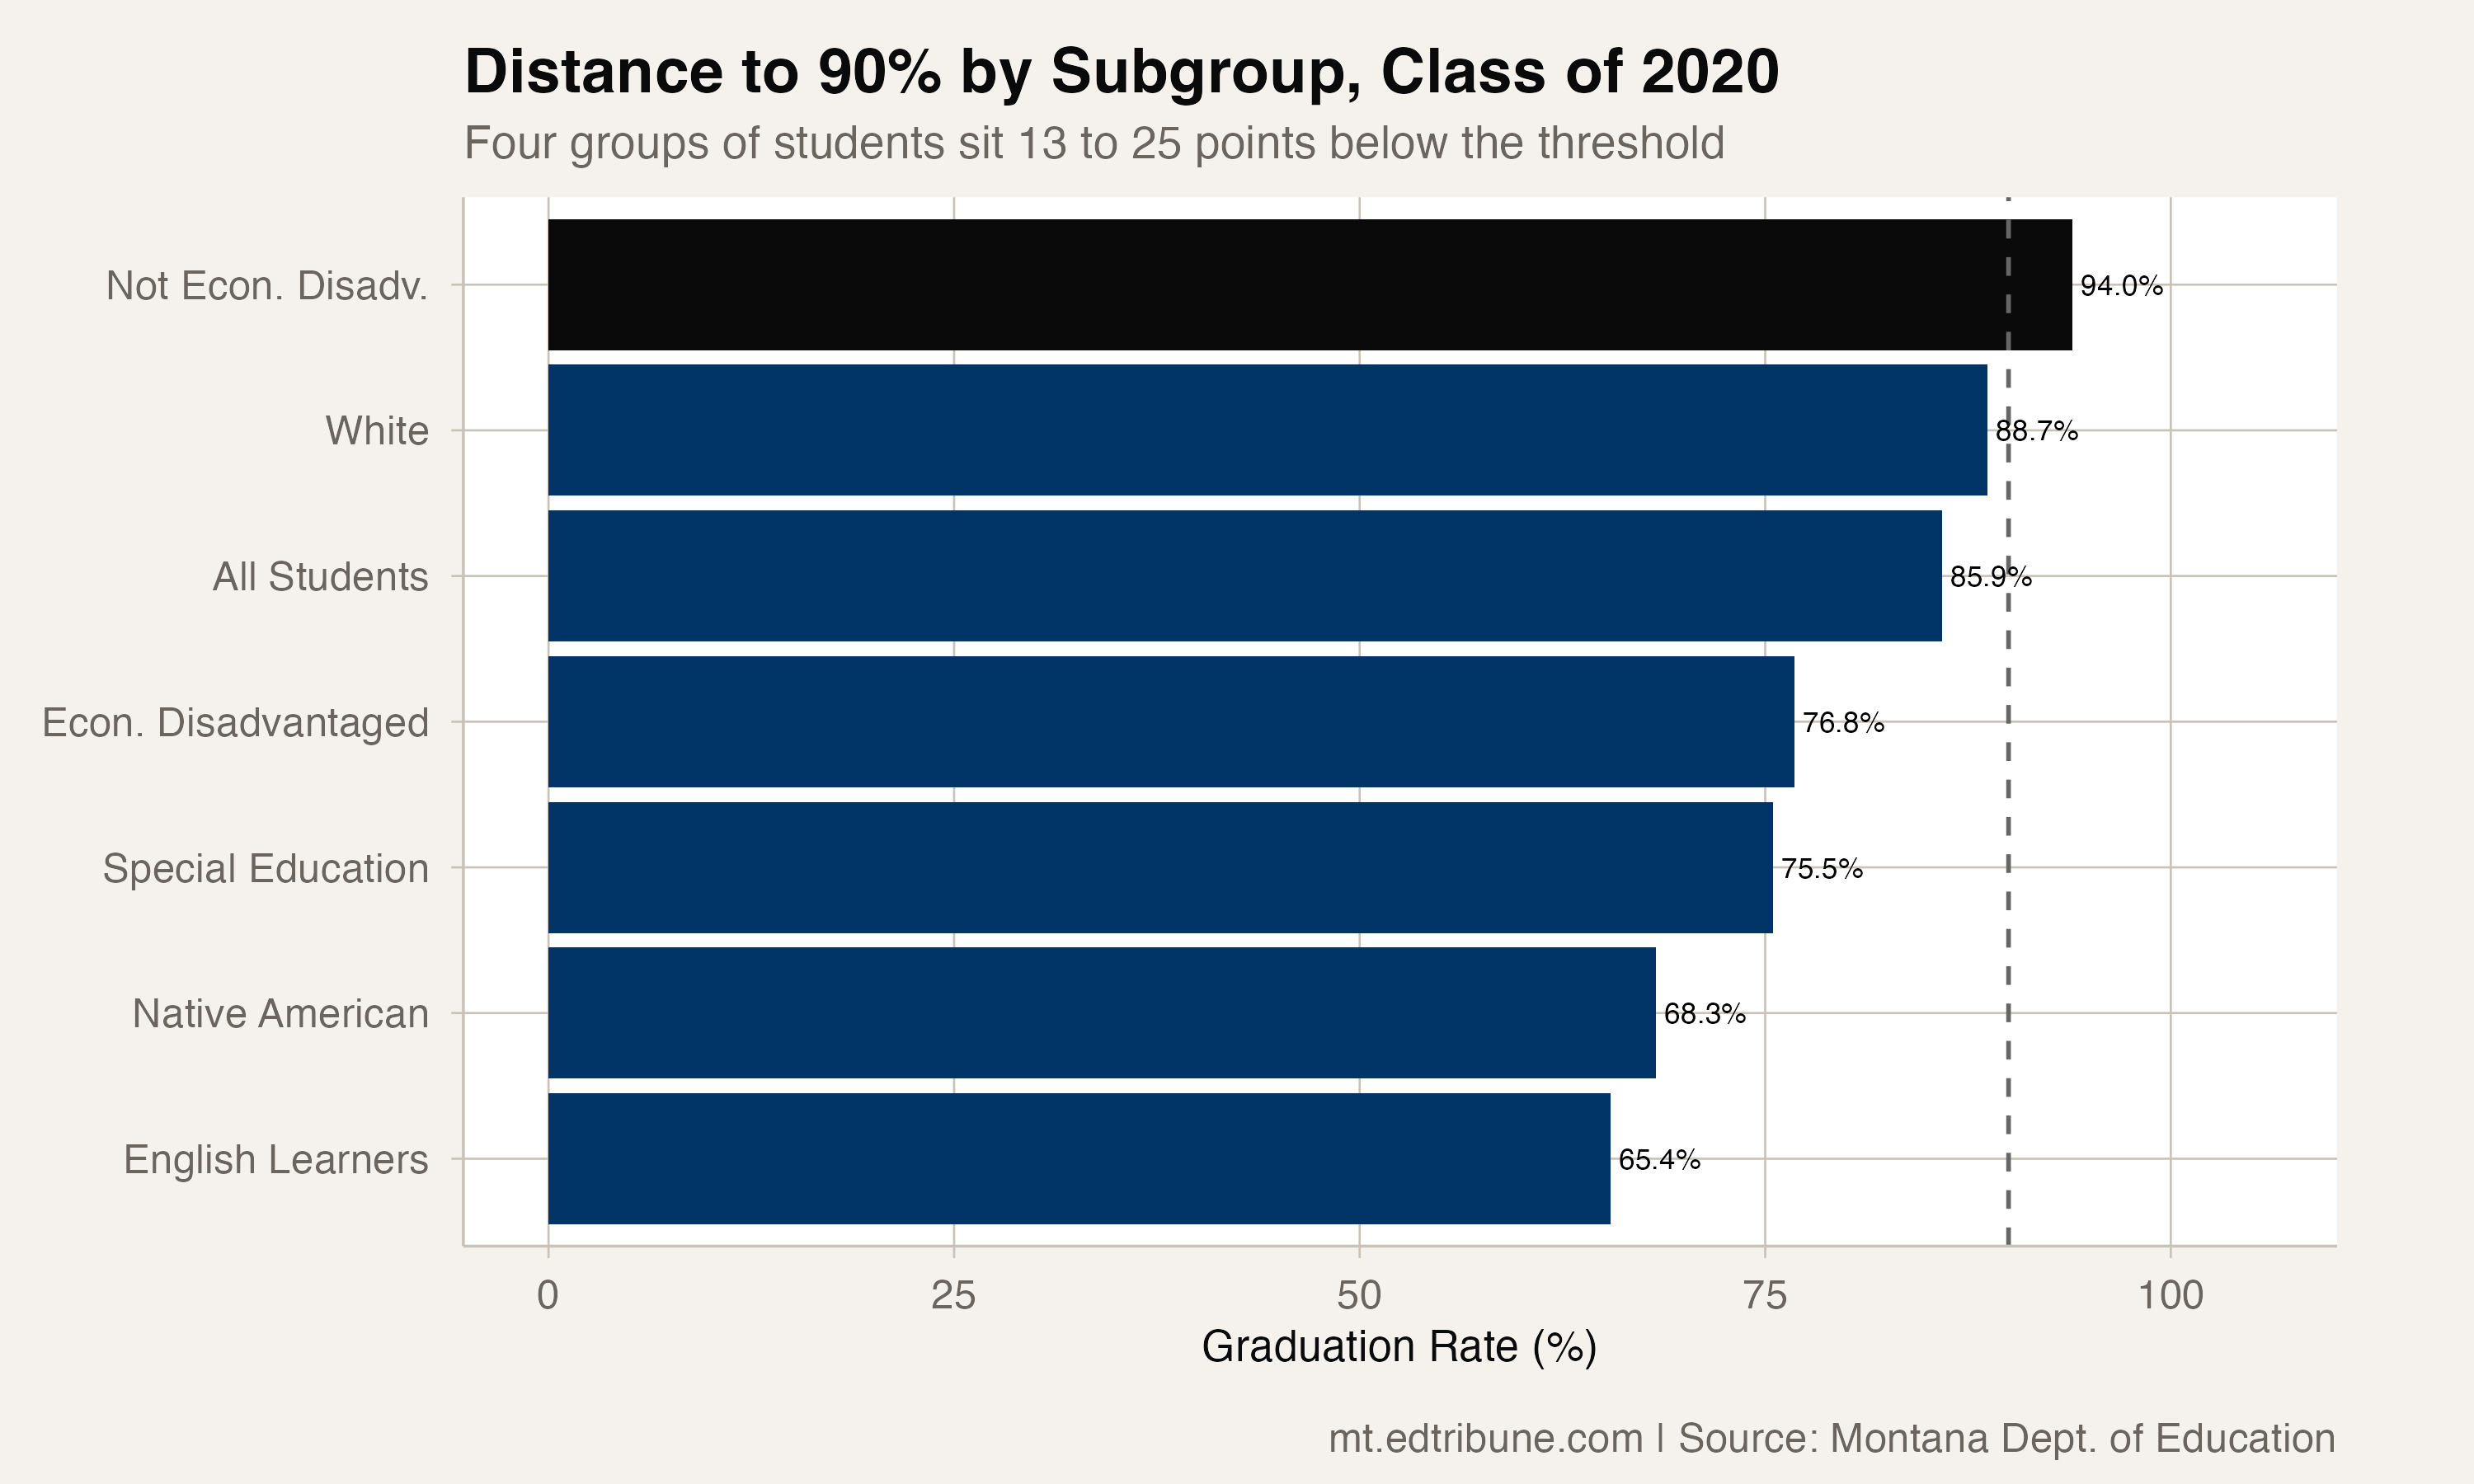
The overall rate is held below 90% by four groups of students. These are their rates for the class of 2020, the last year with a full subgroup breakout:
- English learners graduated at 65.4%, about 25 points below the threshold.
- Native American students graduated at 68.3%, nearly 22 points below.
- Economically disadvantaged students graduated at 76.8%, 13 points below.
- Students in special education graduated at 75.5%, about 14.5 points below.
Native American students are the one group Montana kept reporting after 2020, and that rate has since fallen to 66.1% with the class of 2023.
Each of these groups would need to gain between 13 and 25 percentage points to reach 90% on its own. The largest gain any Montana subgroup posted across the published record is 8.9 points, by English learners, between 2011 and 2020. At that pace, the fastest on record, English learners alone would need roughly 25 more years to reach 90%.
The gap that matters most
Montana's overall graduation rate is an average, and averages are weighted. The subgroup that pulls the average down the most is not necessarily the one with the lowest rate. It is the one with the lowest rate and the largest population.
Economically disadvantaged students are a much larger share of Montana's student body than English learners or Native American students. In 2019-20, students eligible for free or reduced-price lunch were 42.9% of Montana's enrollment, Native American students 10.6%, and English learners 2.4%. A 76.8% rate applied to that many students moves the state average more than a lower rate applied to a smaller group.
This is why the poverty gap is the key to 90%. Even if Native American students reached 80% and English learners reached 75%, gains of about 12 and 10 points, Montana would still fall short unless economically disadvantaged students also improved substantially.
Fourteen years of trying
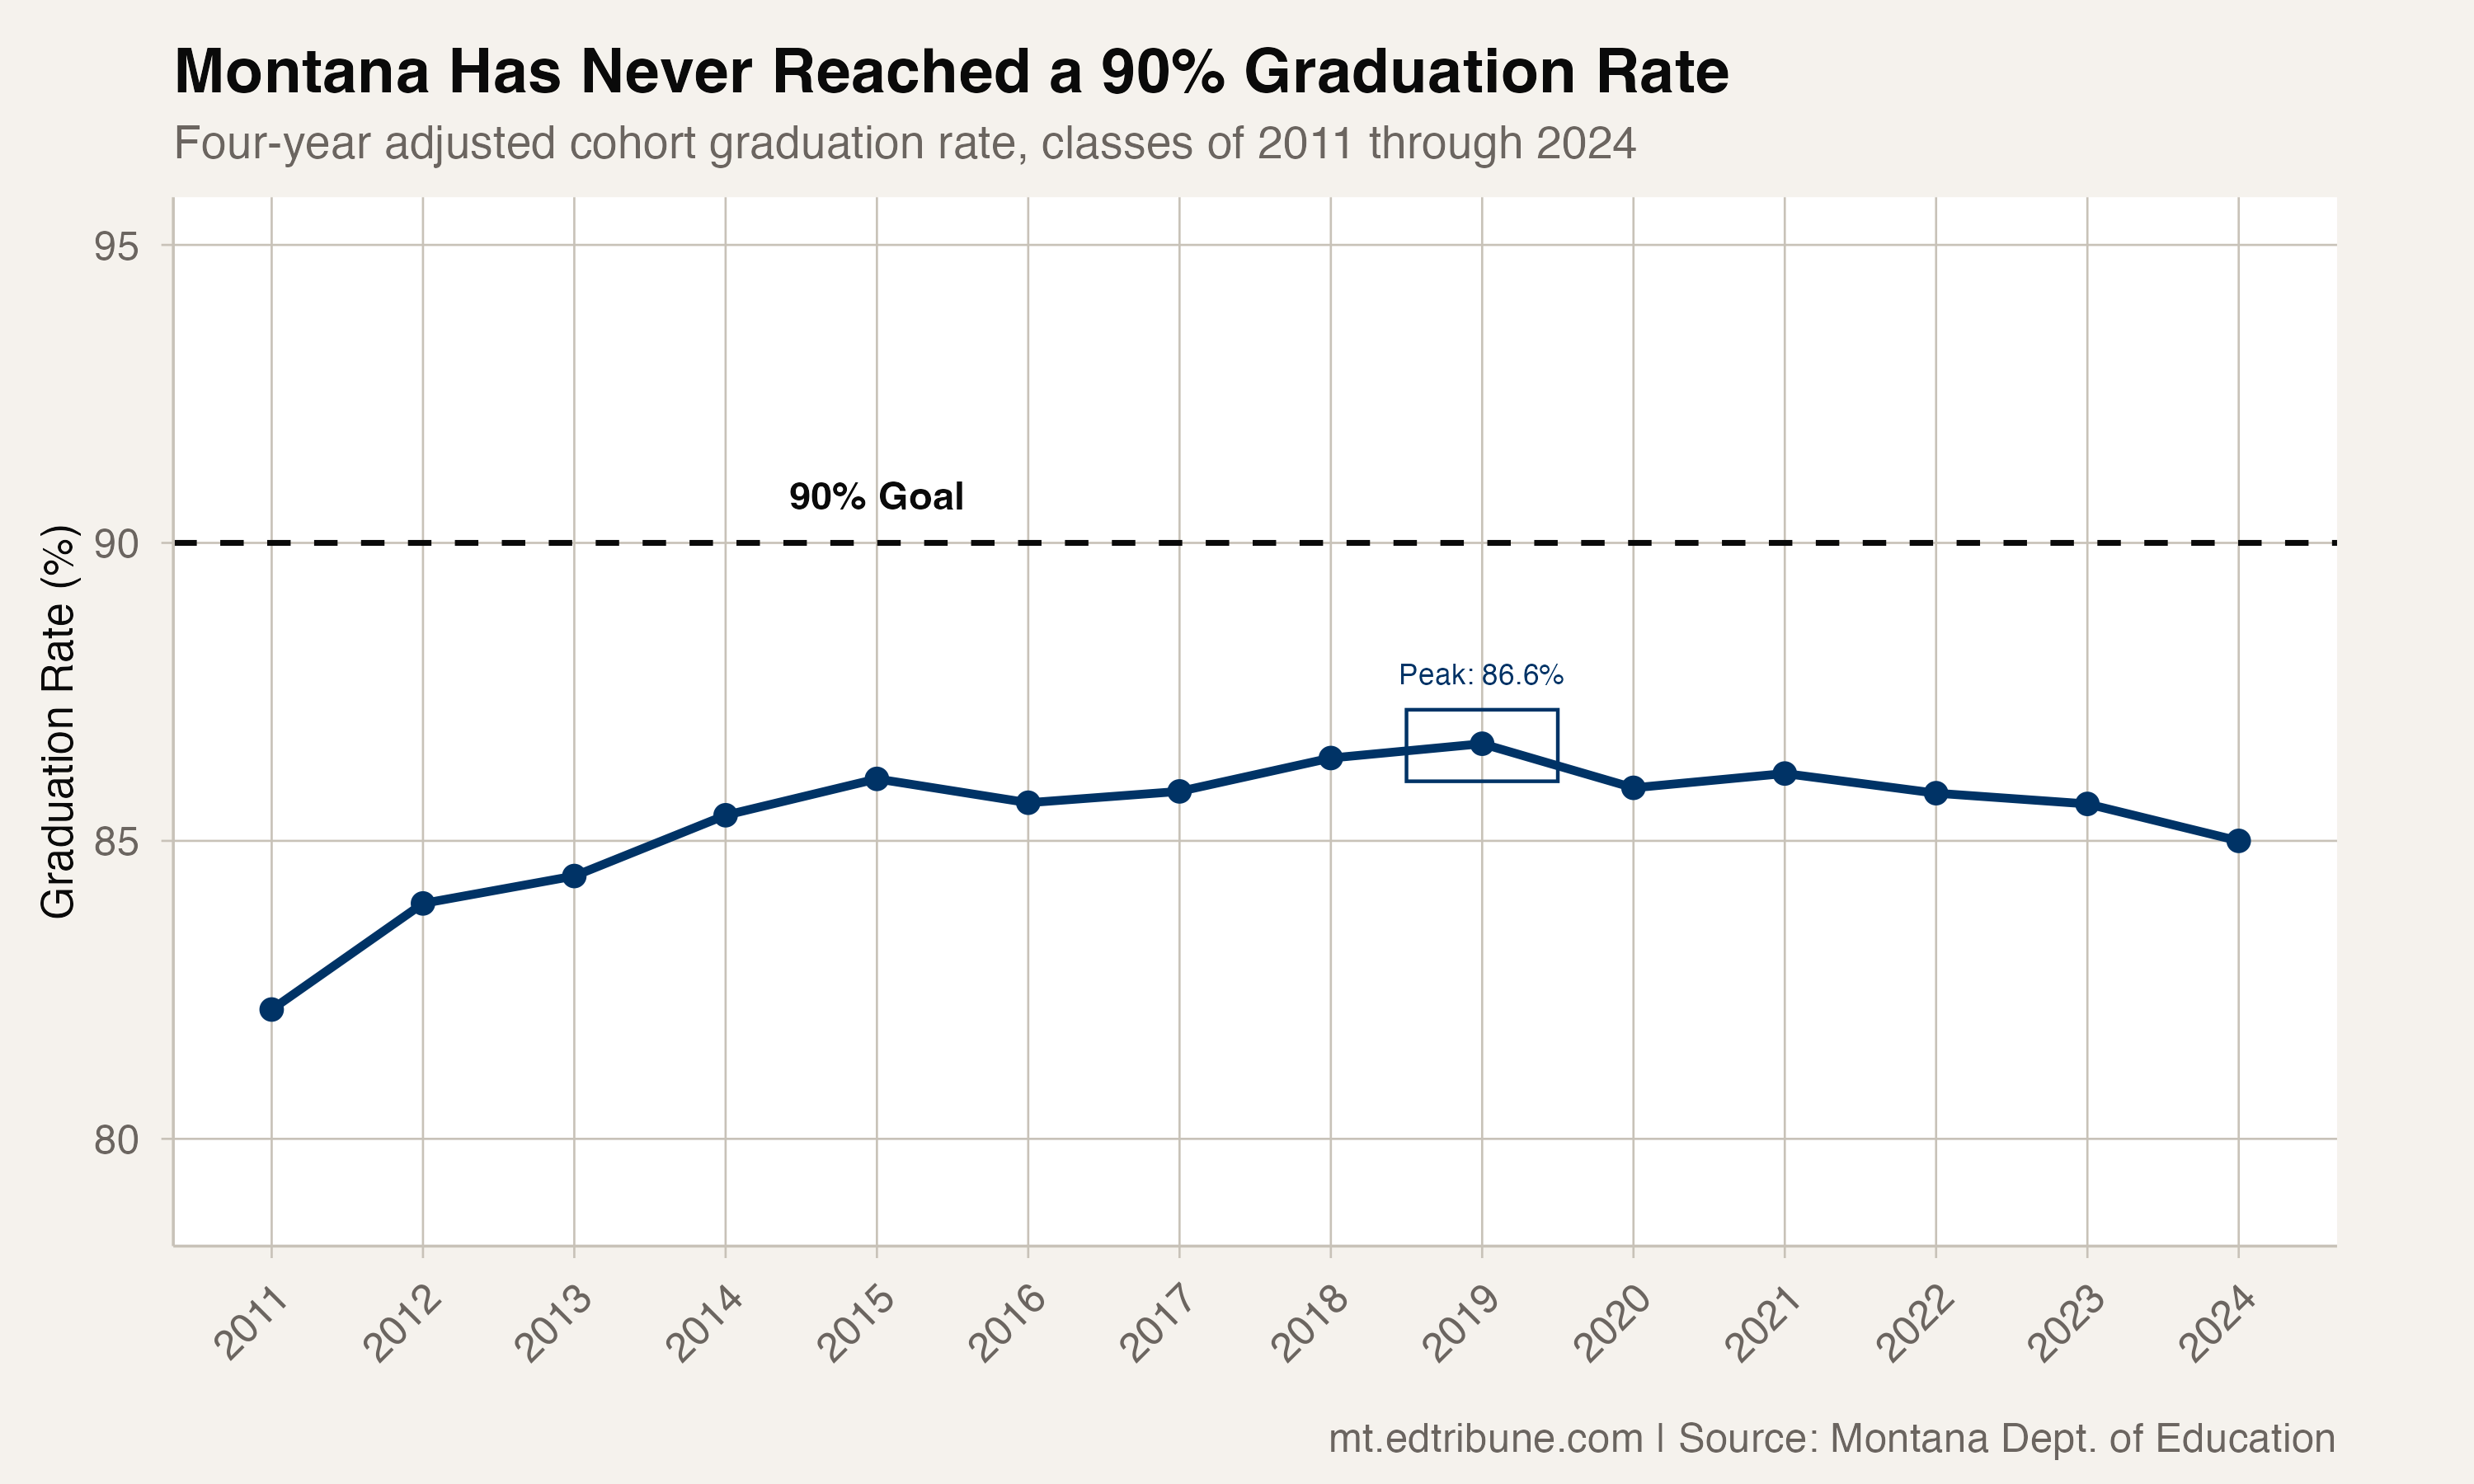
The trajectory tells the story. Montana gained 3.9 points between the classes of 2011 and 2015, held between 85.6% and 86.6% for the next five years, and has fallen in each of the last three.
The state got within 3.4 points of 90% with the class of 2019. It has not been that close since.
The class of 2024's 85.0% puts Montana exactly 5 points from 90%, further from the threshold than in any year since 2013. That gives back 1.6 of the 4.5 points Montana gained between 2011 and 2019, a little over a third of the climb.
What 90% would require
A thought experiment: what would Montana's subgroup rates need to look like for the state to reach 90%?
Montana's published all-student, economically disadvantaged, and not-economically-disadvantaged rates imply that economically disadvantaged students were about 47% of the class of 2020. Hold the non-disadvantaged rate where it was that year, at 94.0%, and economically disadvantaged students would have to graduate at about 85.5% for the state to reach 90%, up from 76.8%.
The four groups overlap, so there is no single set of subgroup targets that produces 90%. But the scale of the change is clear. On the class of 2020 rates, it would take something like:
- Native American students: from 68.3% to roughly 82%
- English learners: from 65.4% to roughly 80%
- Economically disadvantaged students: from 76.8% to roughly 85.5%
- Students in special education: from 75.5% to roughly 82%
These are not impossible numbers. Other states achieve them. But Montana has never produced gains of this magnitude across multiple subgroups at once. The largest single-subgroup improvement in the published record is 8.9 points, for English learners, over the nine years from 2011 to 2020. Reaching 90% would require several subgroups to match or exceed that pace concurrently.
The threshold is not the point
Whether Montana graduates at 89% or 91% is less important than the gaps the data reveals. A state where, in its last full subgroup report, students not eligible for free or reduced-price lunch graduated at 94.0% and students who were eligible graduated at 76.8% has an equity problem, regardless of where the average falls.
But the 90% threshold matters symbolically and politically. It is the benchmark that legislators reference, that superintendents set as goals, and that rankings use to compare states. Montana has not reached it after a decade of sustained improvement followed by five years of slippage.
The distance to 90% is not spread evenly across Montana's students. Almost all of it sits with the four groups the state's own reporting already places furthest behind.
Data source: Analysis uses four-year adjusted cohort graduation rate data and fall enrollment counts from the Montana Office of Public Instruction. The all-student graduation rate covers the classes of 2011 through 2024. A full set of subgroup rates is published only through the class of 2020; Montana continued to report rates for Native American students and for female and male students through the class of 2023, and for all students only in 2024.
Detailed code that reproduces the analysis and figures in this article is available exclusively to EdTribune subscribers.
Discussion
Sign in to join the discussion.
Loading comments...