Between 2011 and 2015, Montana's four-year graduation rate climbed from 82.2% to 86.0% — a 3.9-point gain across four consecutive annual increases.
After 2015, the rate stayed within a 1.0-point band: 85.6% to 86.6% from 2016 through 2019. It peaked at 86.6% in 2019, then fell to 85.0% by 2024, 1.6 points below the peak.
The record shows a clear change in direction. It does not, by itself, identify what caused the rise or the later decline.
The surge years
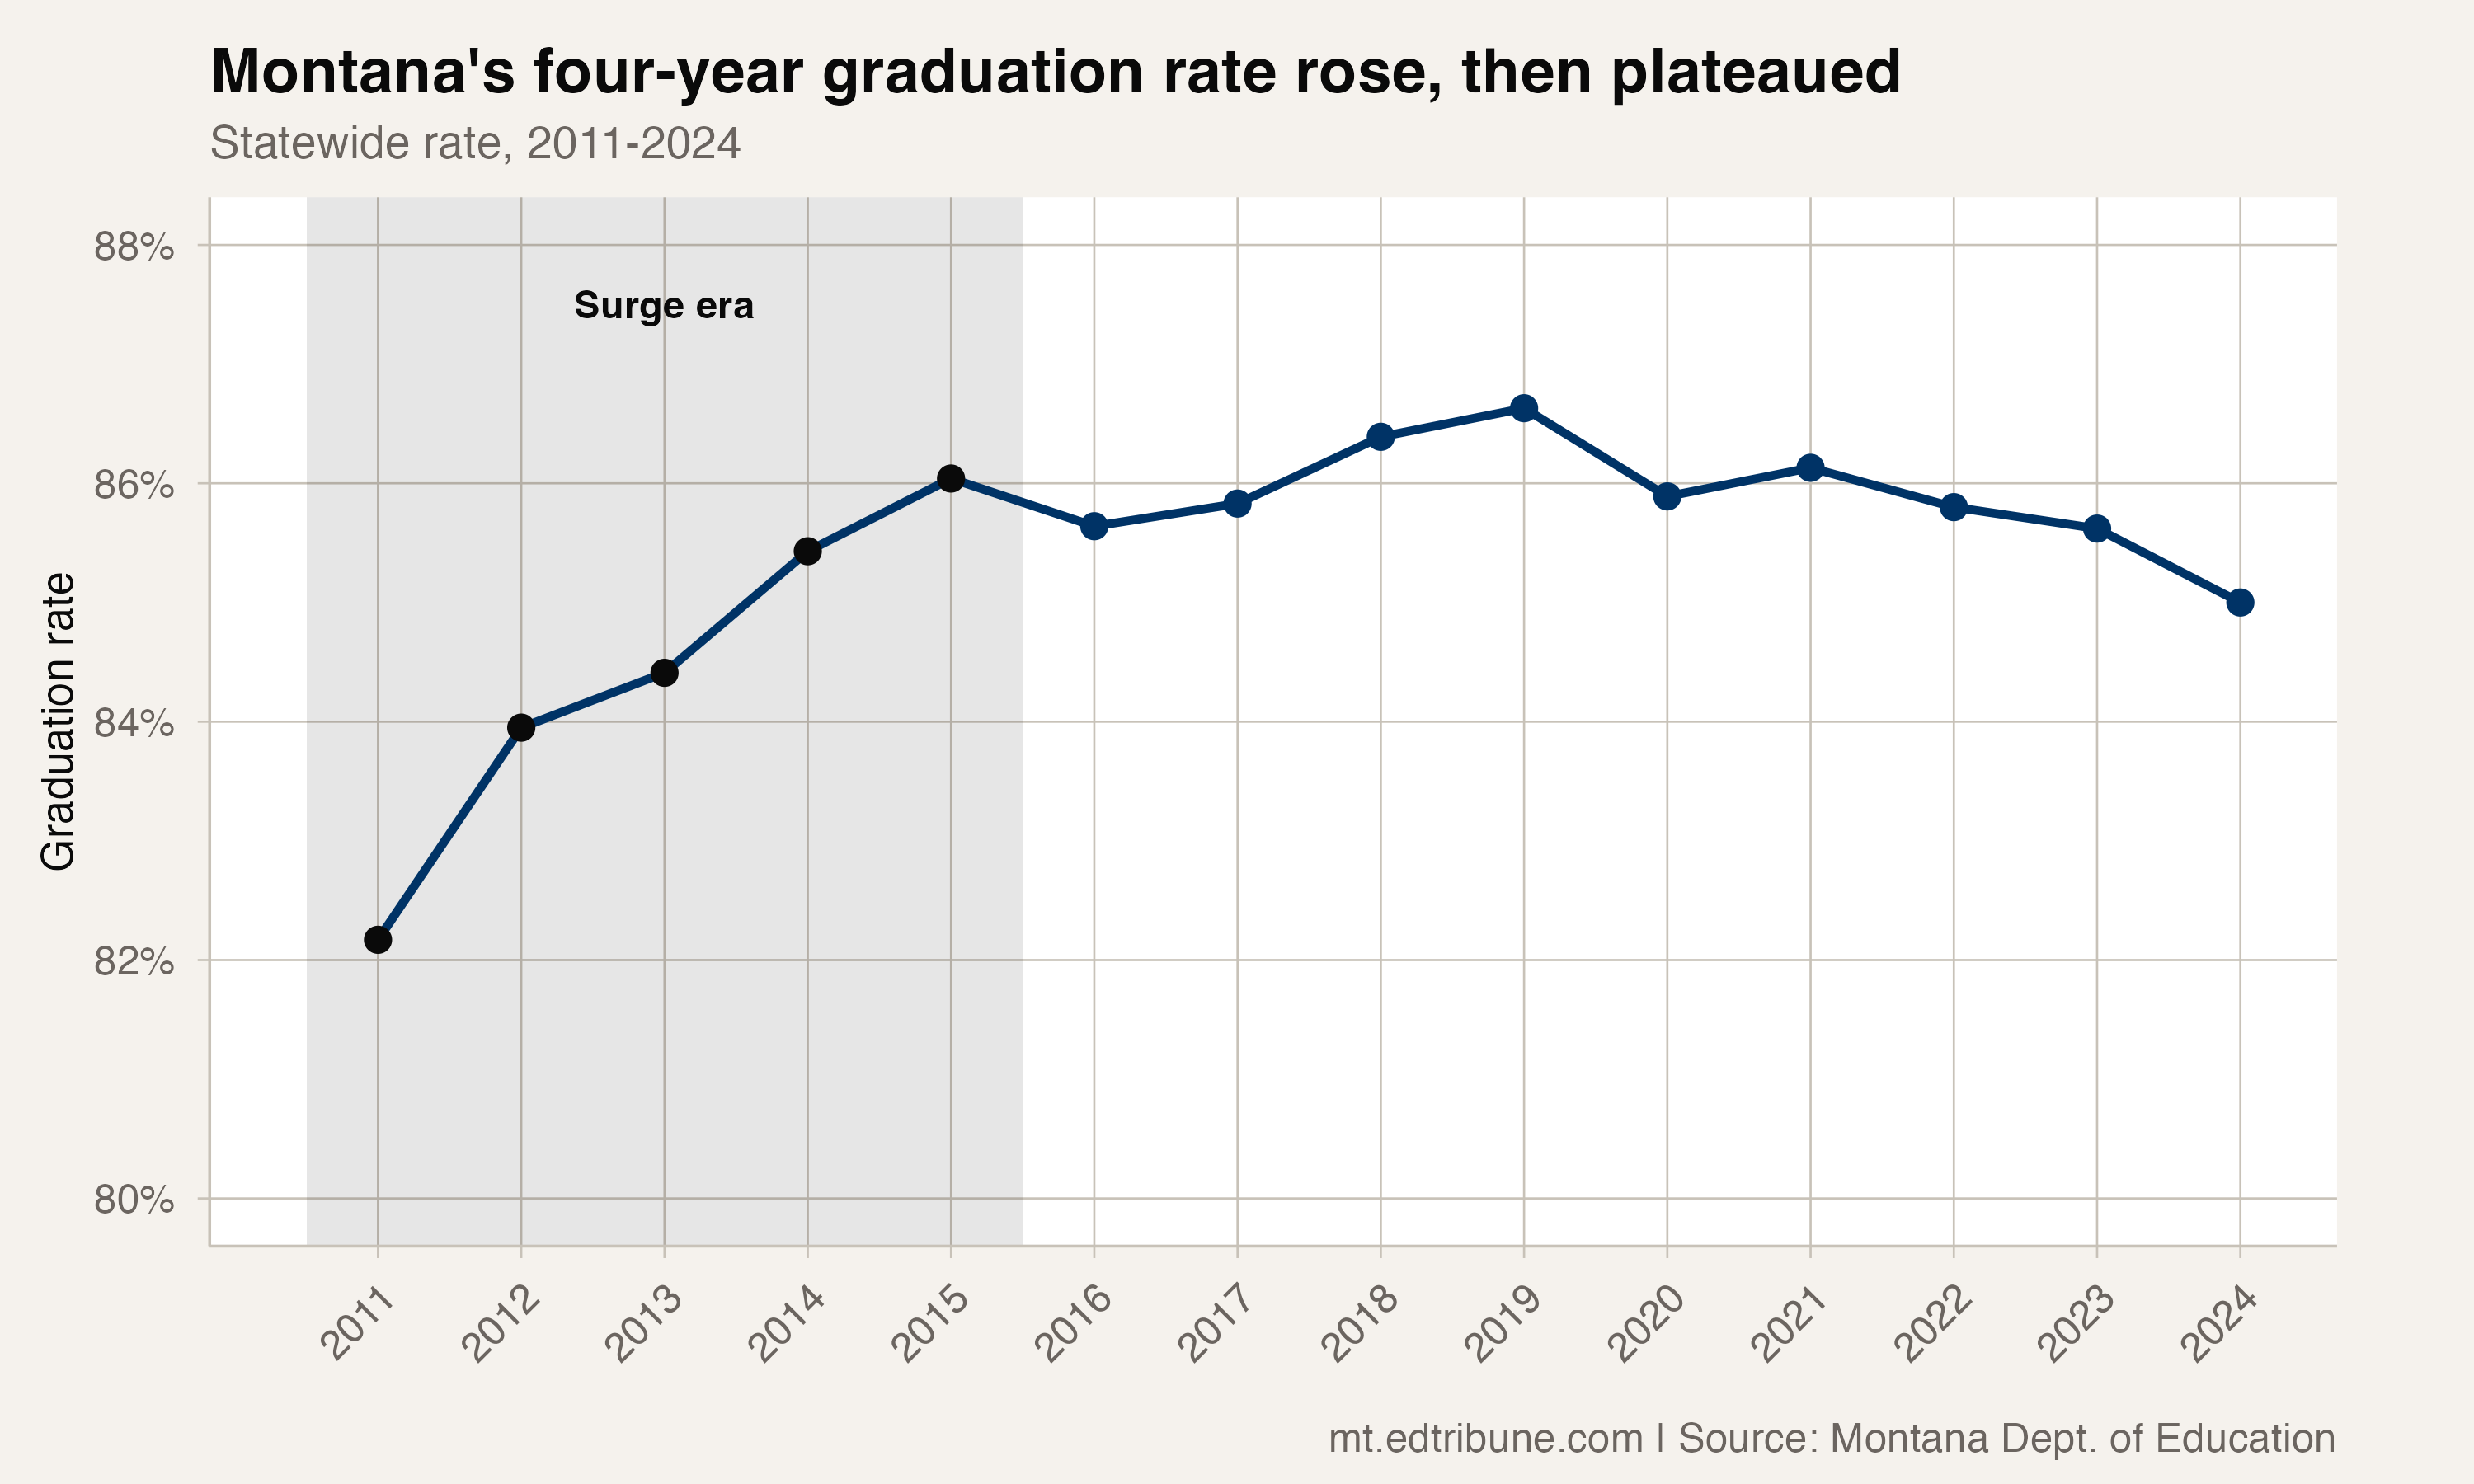
The 2011-2015 improvement was consistent: the annual changes were +1.78 points in 2012, +0.46 in 2013, +1.02 in 2014 and +0.61 in 2015. Every year was a gain, for a total of 3.9 points.
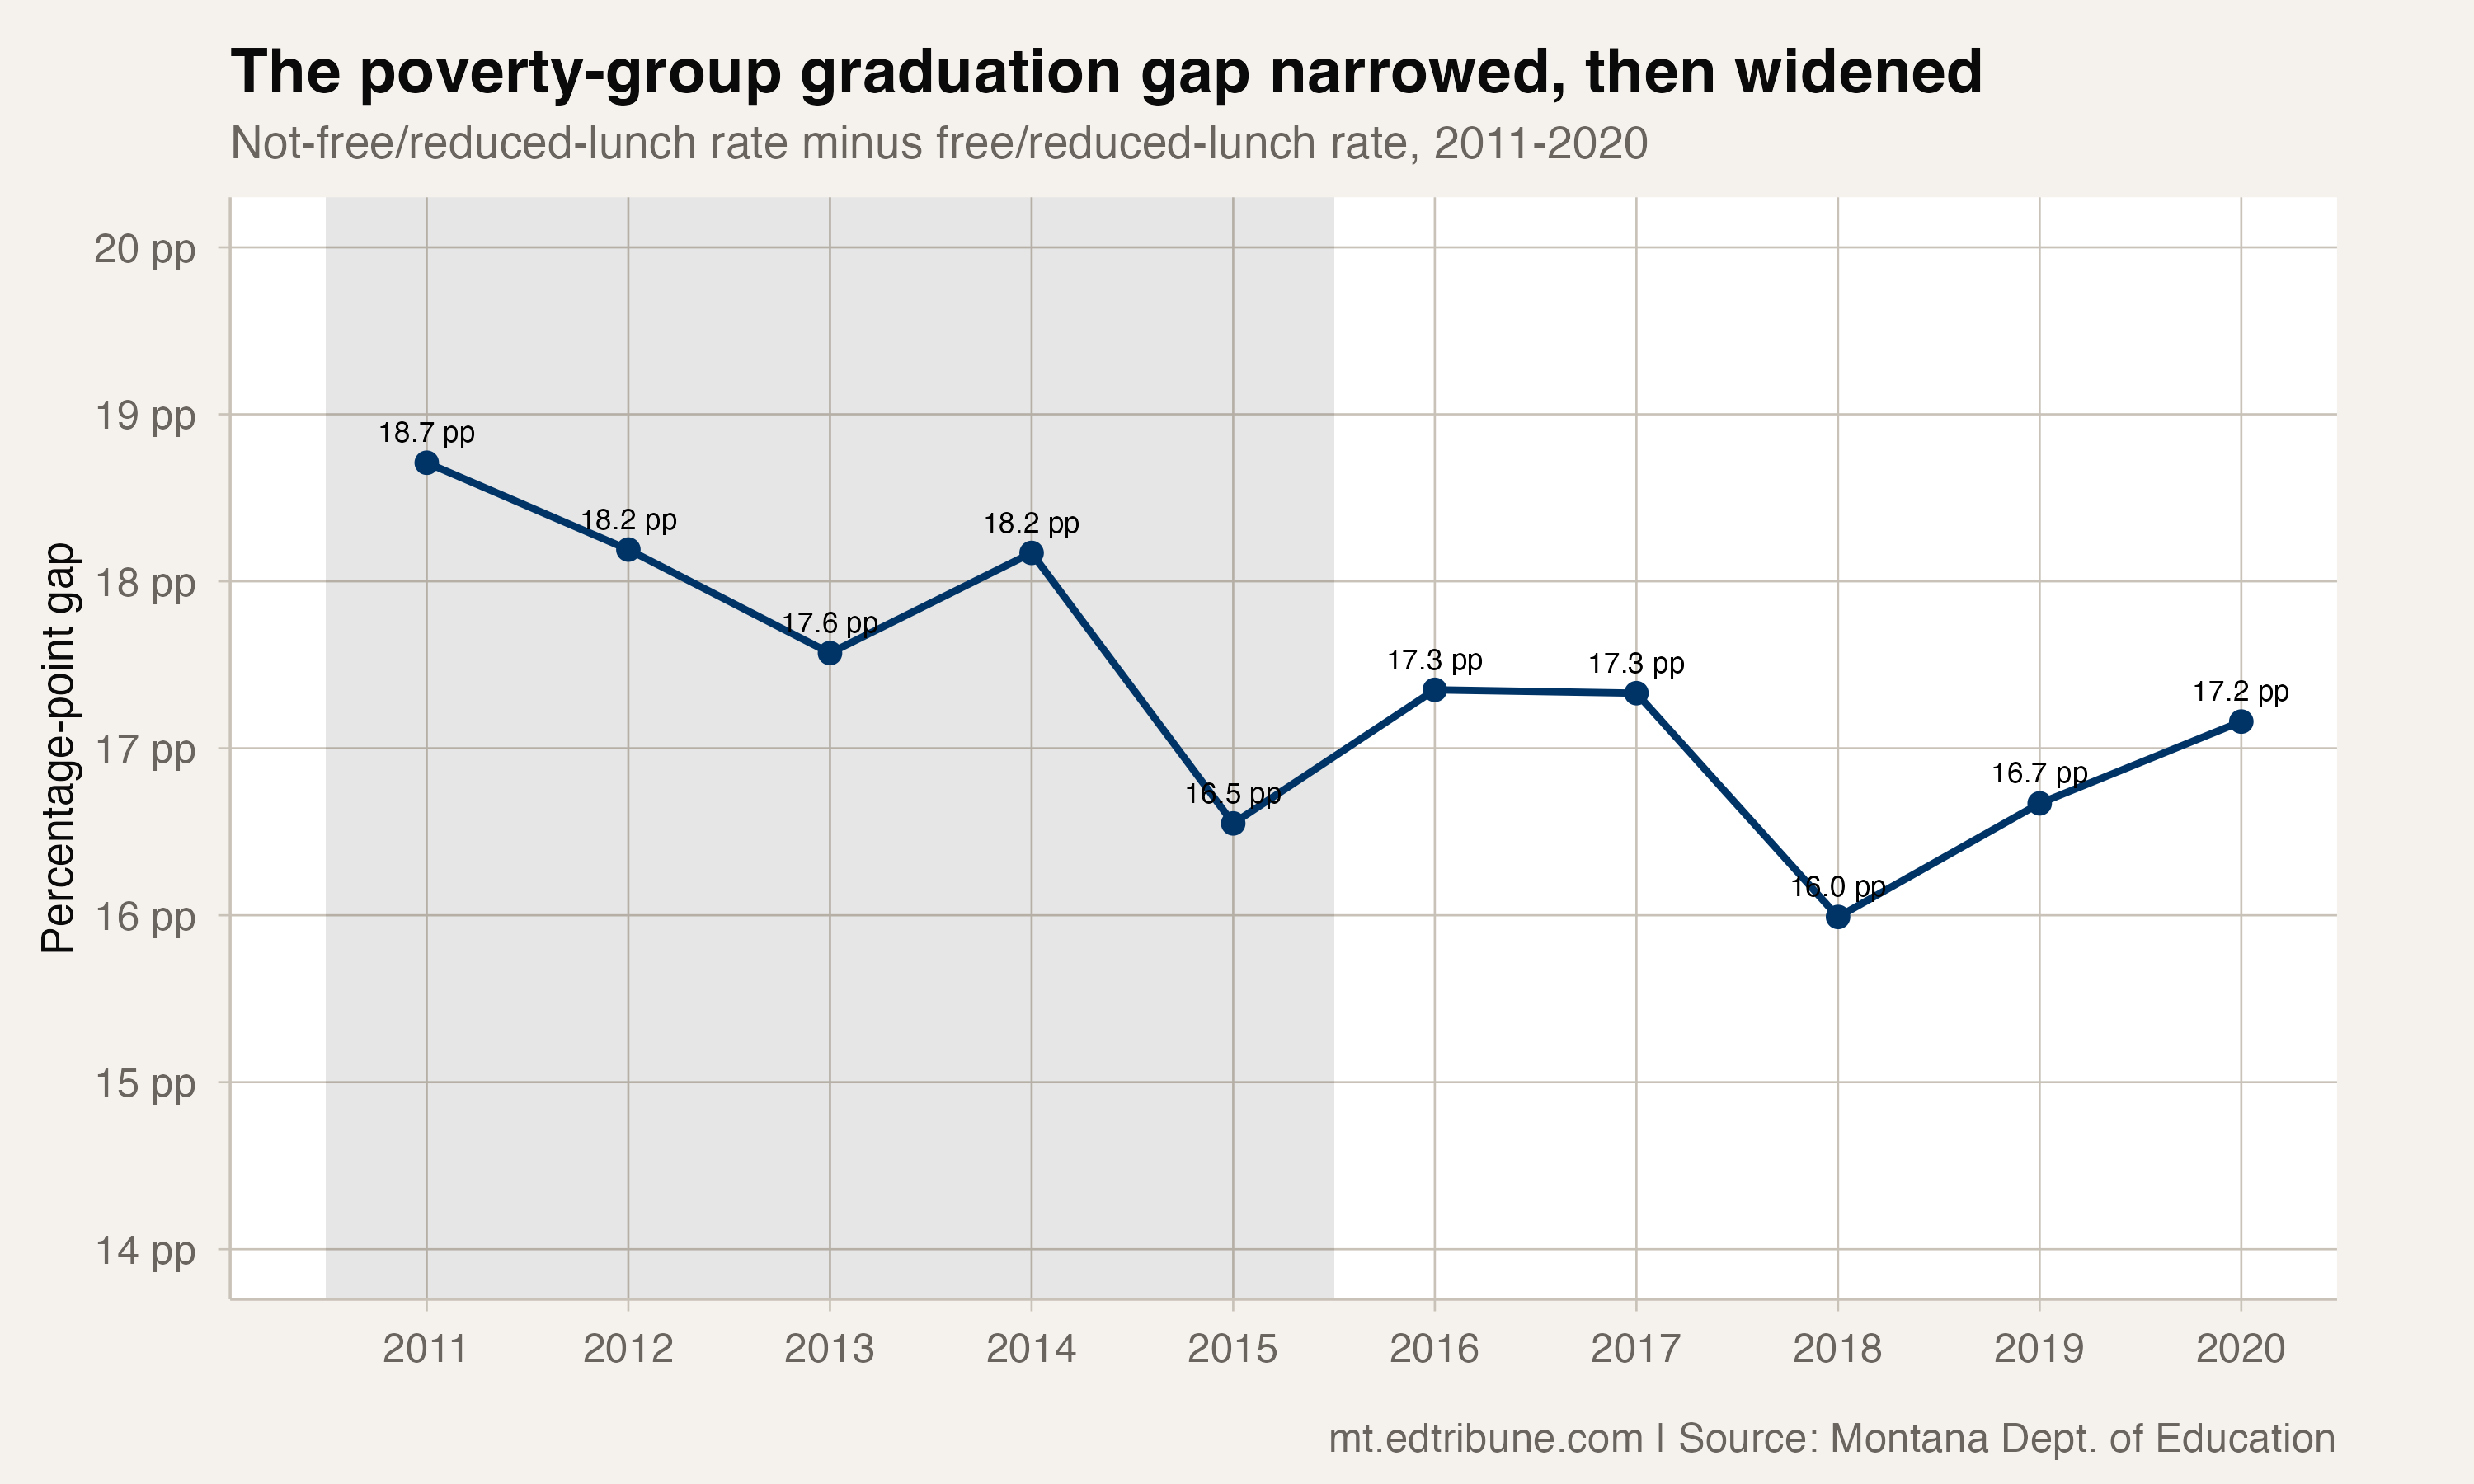
The poverty-group gap narrowed from 18.7 points in 2011 to 16.5 points in 2015. That is a parallel pattern in the published data, not proof that one change caused the other.
The plateau
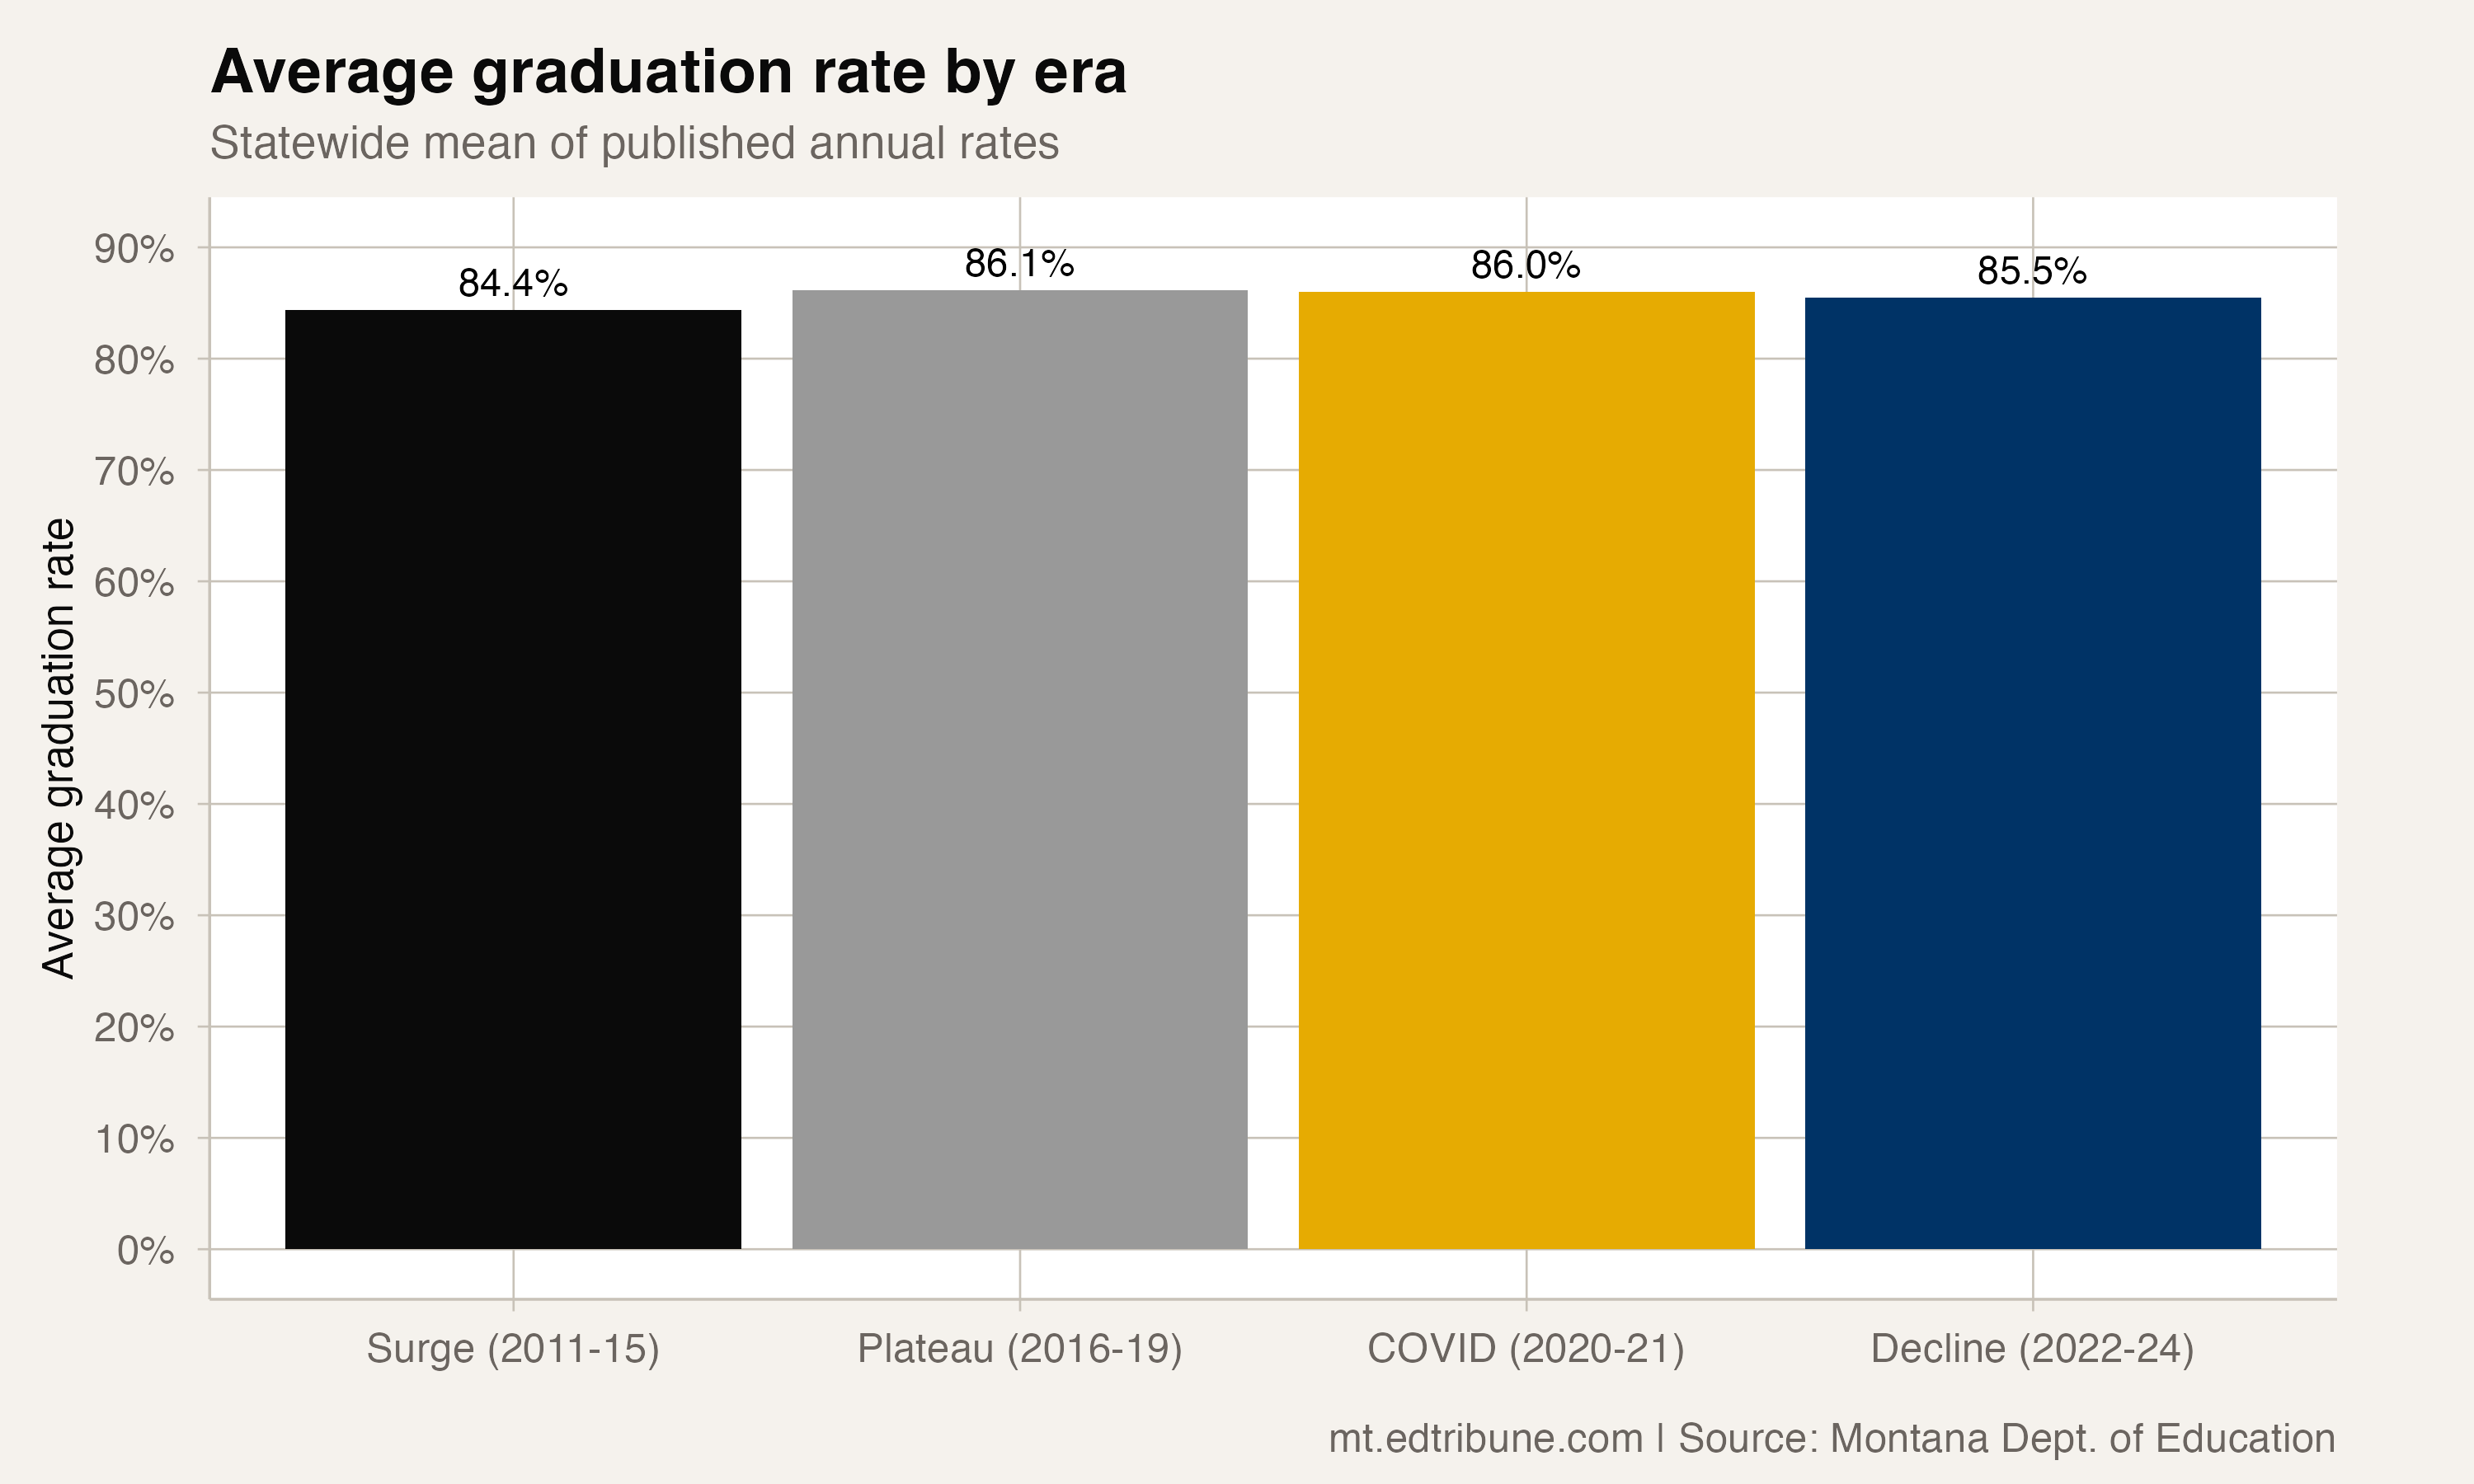
From 2016 through 2019, Montana's graduation rate oscillated in a one-point band. The low was 85.6% in 2016; the high was 86.6% in 2019. The average for the four years was 86.1% -- essentially flat.
The poverty-group gap later widened to 17.3 points in 2017. The series does not show why that happened, and it cannot establish whether the statewide rate and the poverty-group gap moved together because of the same underlying forces.
What the record can and cannot explain
Direct evidence: Montana gained 3.9 points across four consecutive annual increases from 2011 through 2015, stayed within a 1.0-point range through 2019, and then posted three consecutive annual declines from 2022 through 2024.
Competing explanation: Changes in cohort composition, measurement, local conditions or student supports could all affect a statewide graduation series. These records do not distinguish among those possibilities.
Unresourced: The data cannot identify a specific intervention that caused the surge or explain why the rate later fell. Any account of a program effect would require evidence beyond the published rates.
The decline era
Since 2022, Montana has posted three consecutive years of declining graduation rates: -0.33 points in 2022, -0.18 in 2023 and -0.62 in 2024. The 2024 rate of 85.0% is 1.6 points below the 2019 peak.
The contrast with the surge era is clear. Montana gained 1.78 points in 2012 and lost 0.62 points in 2024. The rate moved from a four-year run of gains to a three-year run of declines.
The data cannot tell us what would reverse the decline. It can establish the timing of the shift and identify the subgroup gap as a related pattern worth investigating with program, cohort and local evidence.
Graduation-rate data comes from the Montana Office of Public Instruction's student-data reports.
Detailed code that reproduces the analysis and figures in this article is available exclusively to EdTribune subscribers.
Discussion
Sign in to join the discussion.
Loading comments...