Correction (July 21, 2026): The previous version treated 2011 as the economic-status baseline even though the current state package has no complete economic-status pair for that year. It also made causal, compositional, national, policy and intervention claims the graduation file cannot test. This version uses the complete 2012-2020 panel, recomputes every change and removes those unsupported explanations.
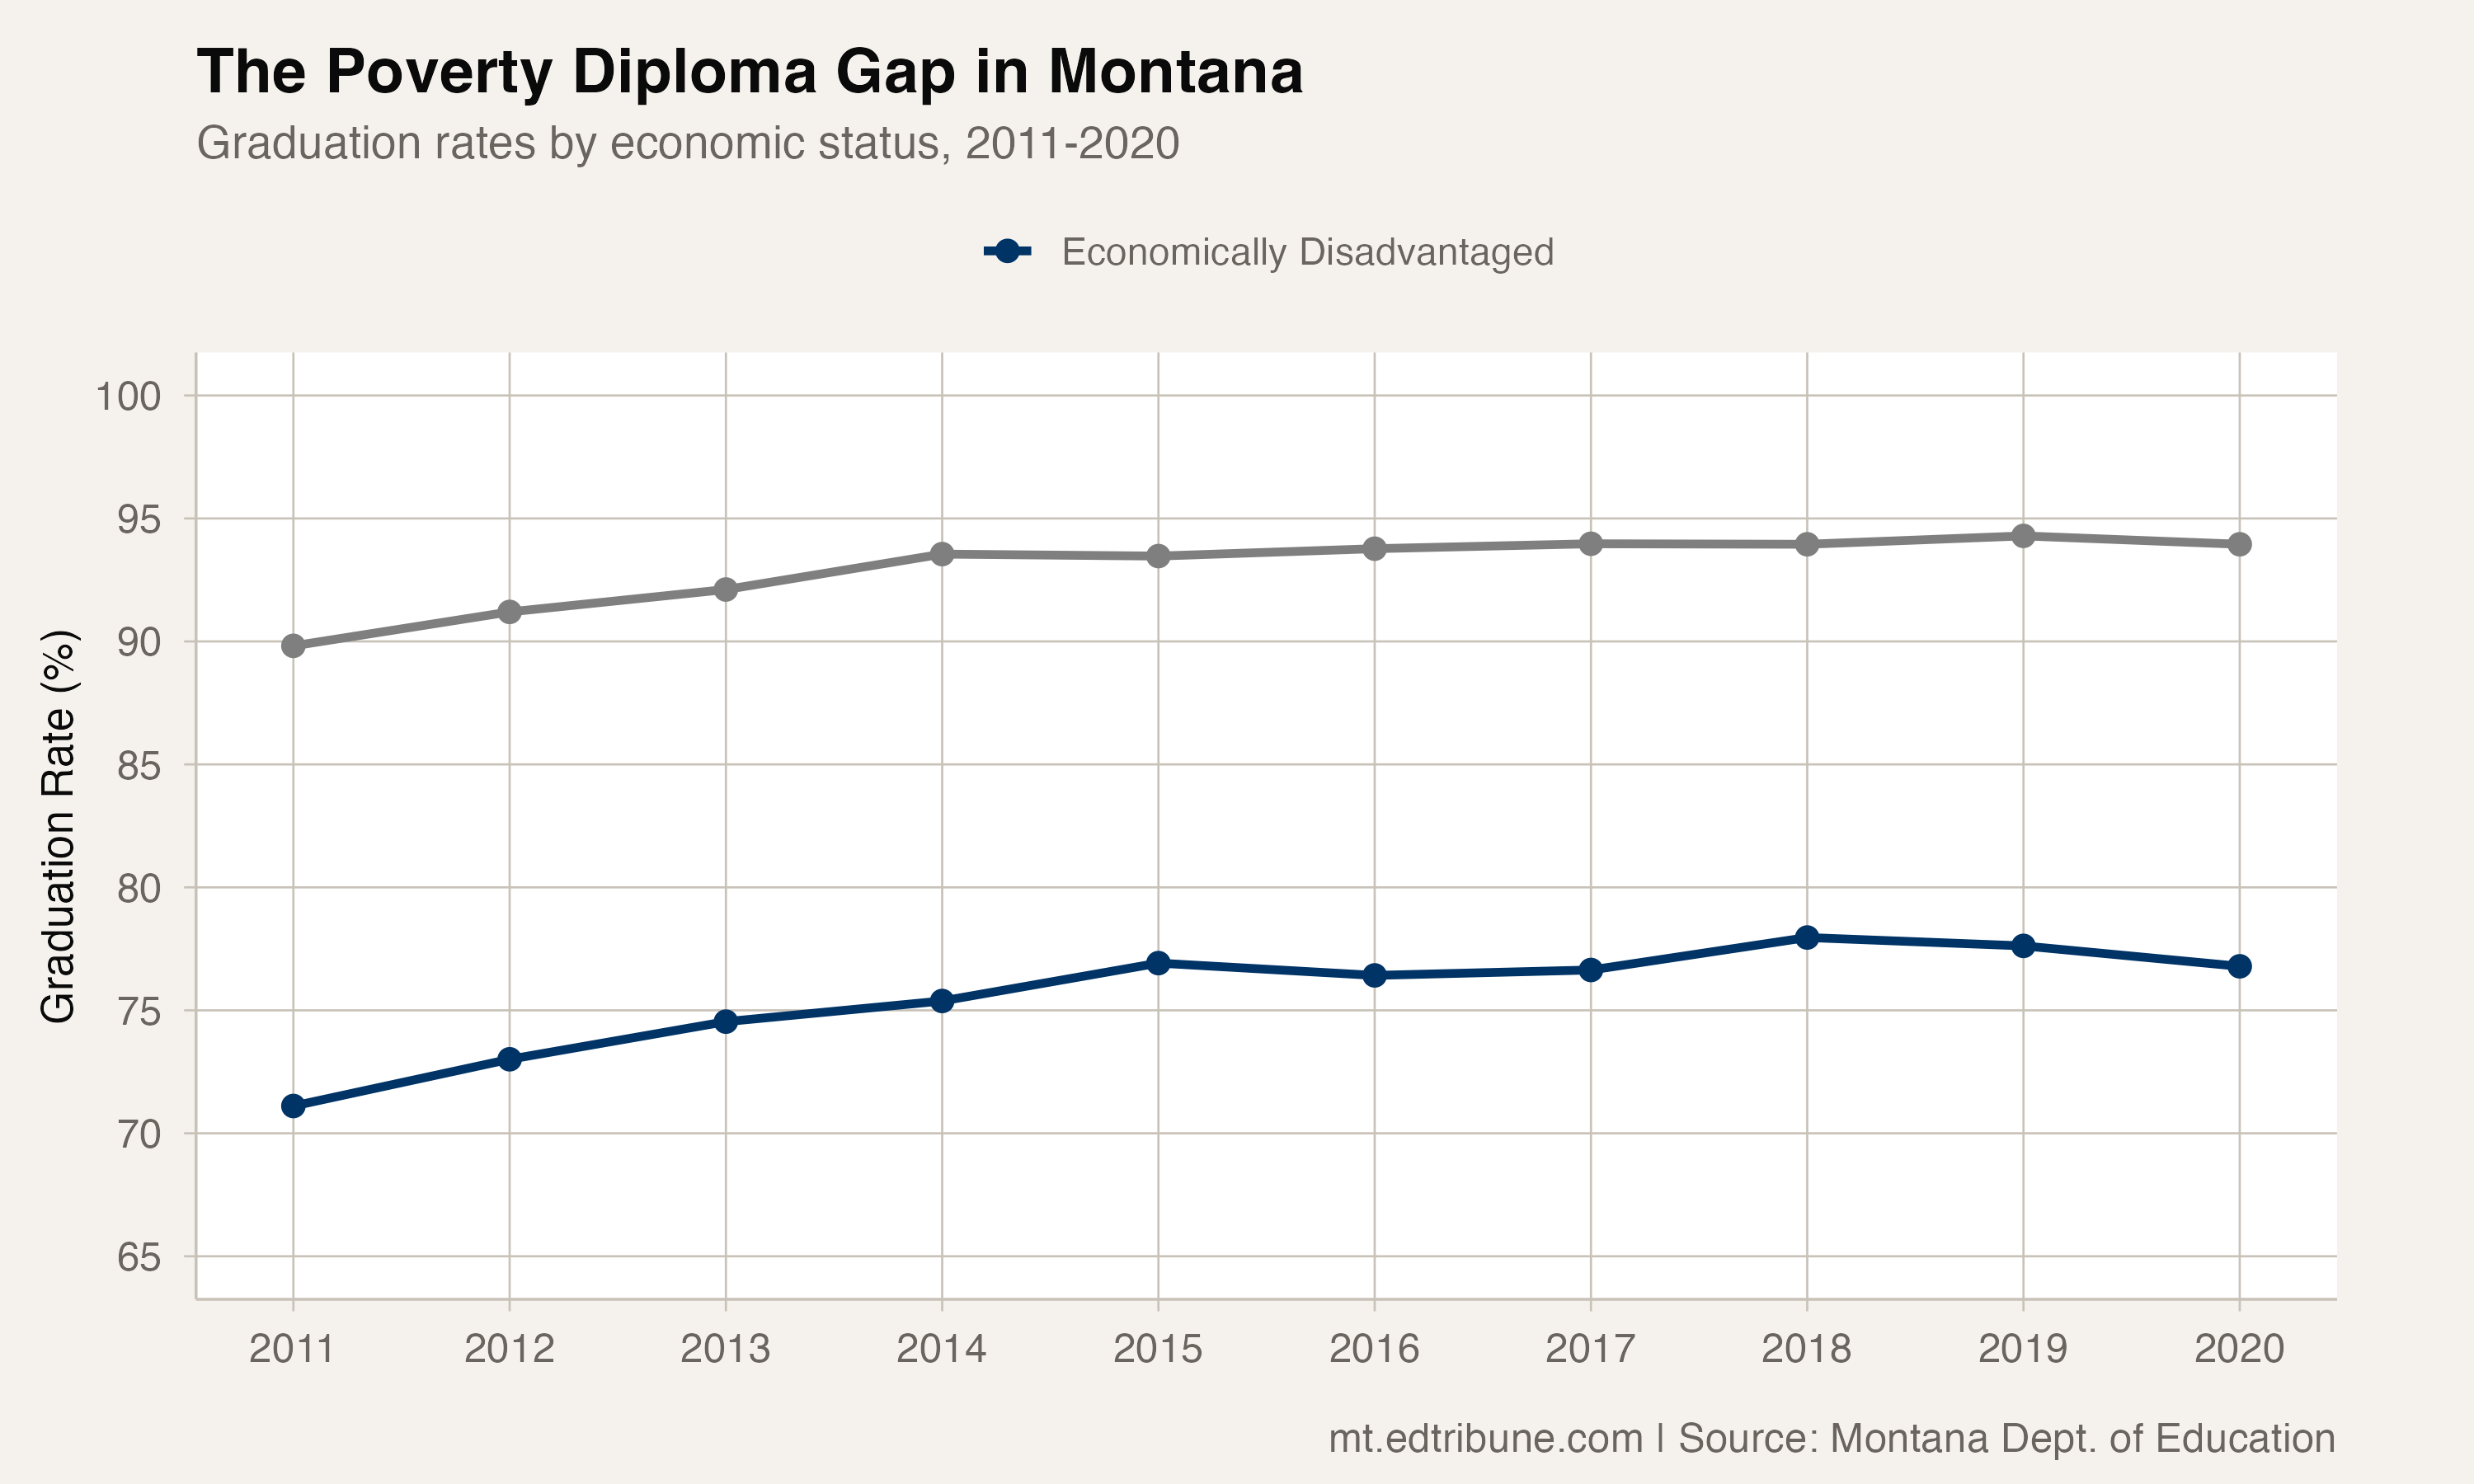
In 2020, Montana's four-year adjusted cohort graduation rate was 76.8% for economically disadvantaged students and 94.0% for students not classified as economically disadvantaged. The difference was 17.2 percentage points.
The state package contains nine complete annual economic-status comparisons, from 2012 through 2020. Across that panel, the gap ranged from 16.0 to 18.2 points.
A high non-disadvantaged rate and a persistent gap
The non-disadvantaged rate was at least 93.5% in each of the seven years from 2014 through 2020. It reached 94.3% in 2019. The economically disadvantaged rate was 76.8% in the panel's final year.
The gap was 18.2 points in 2012. It reached its minimum of 16.0 points in 2018, a 2.2-point narrowing from the first complete year, then increased to 17.2 points by 2020.
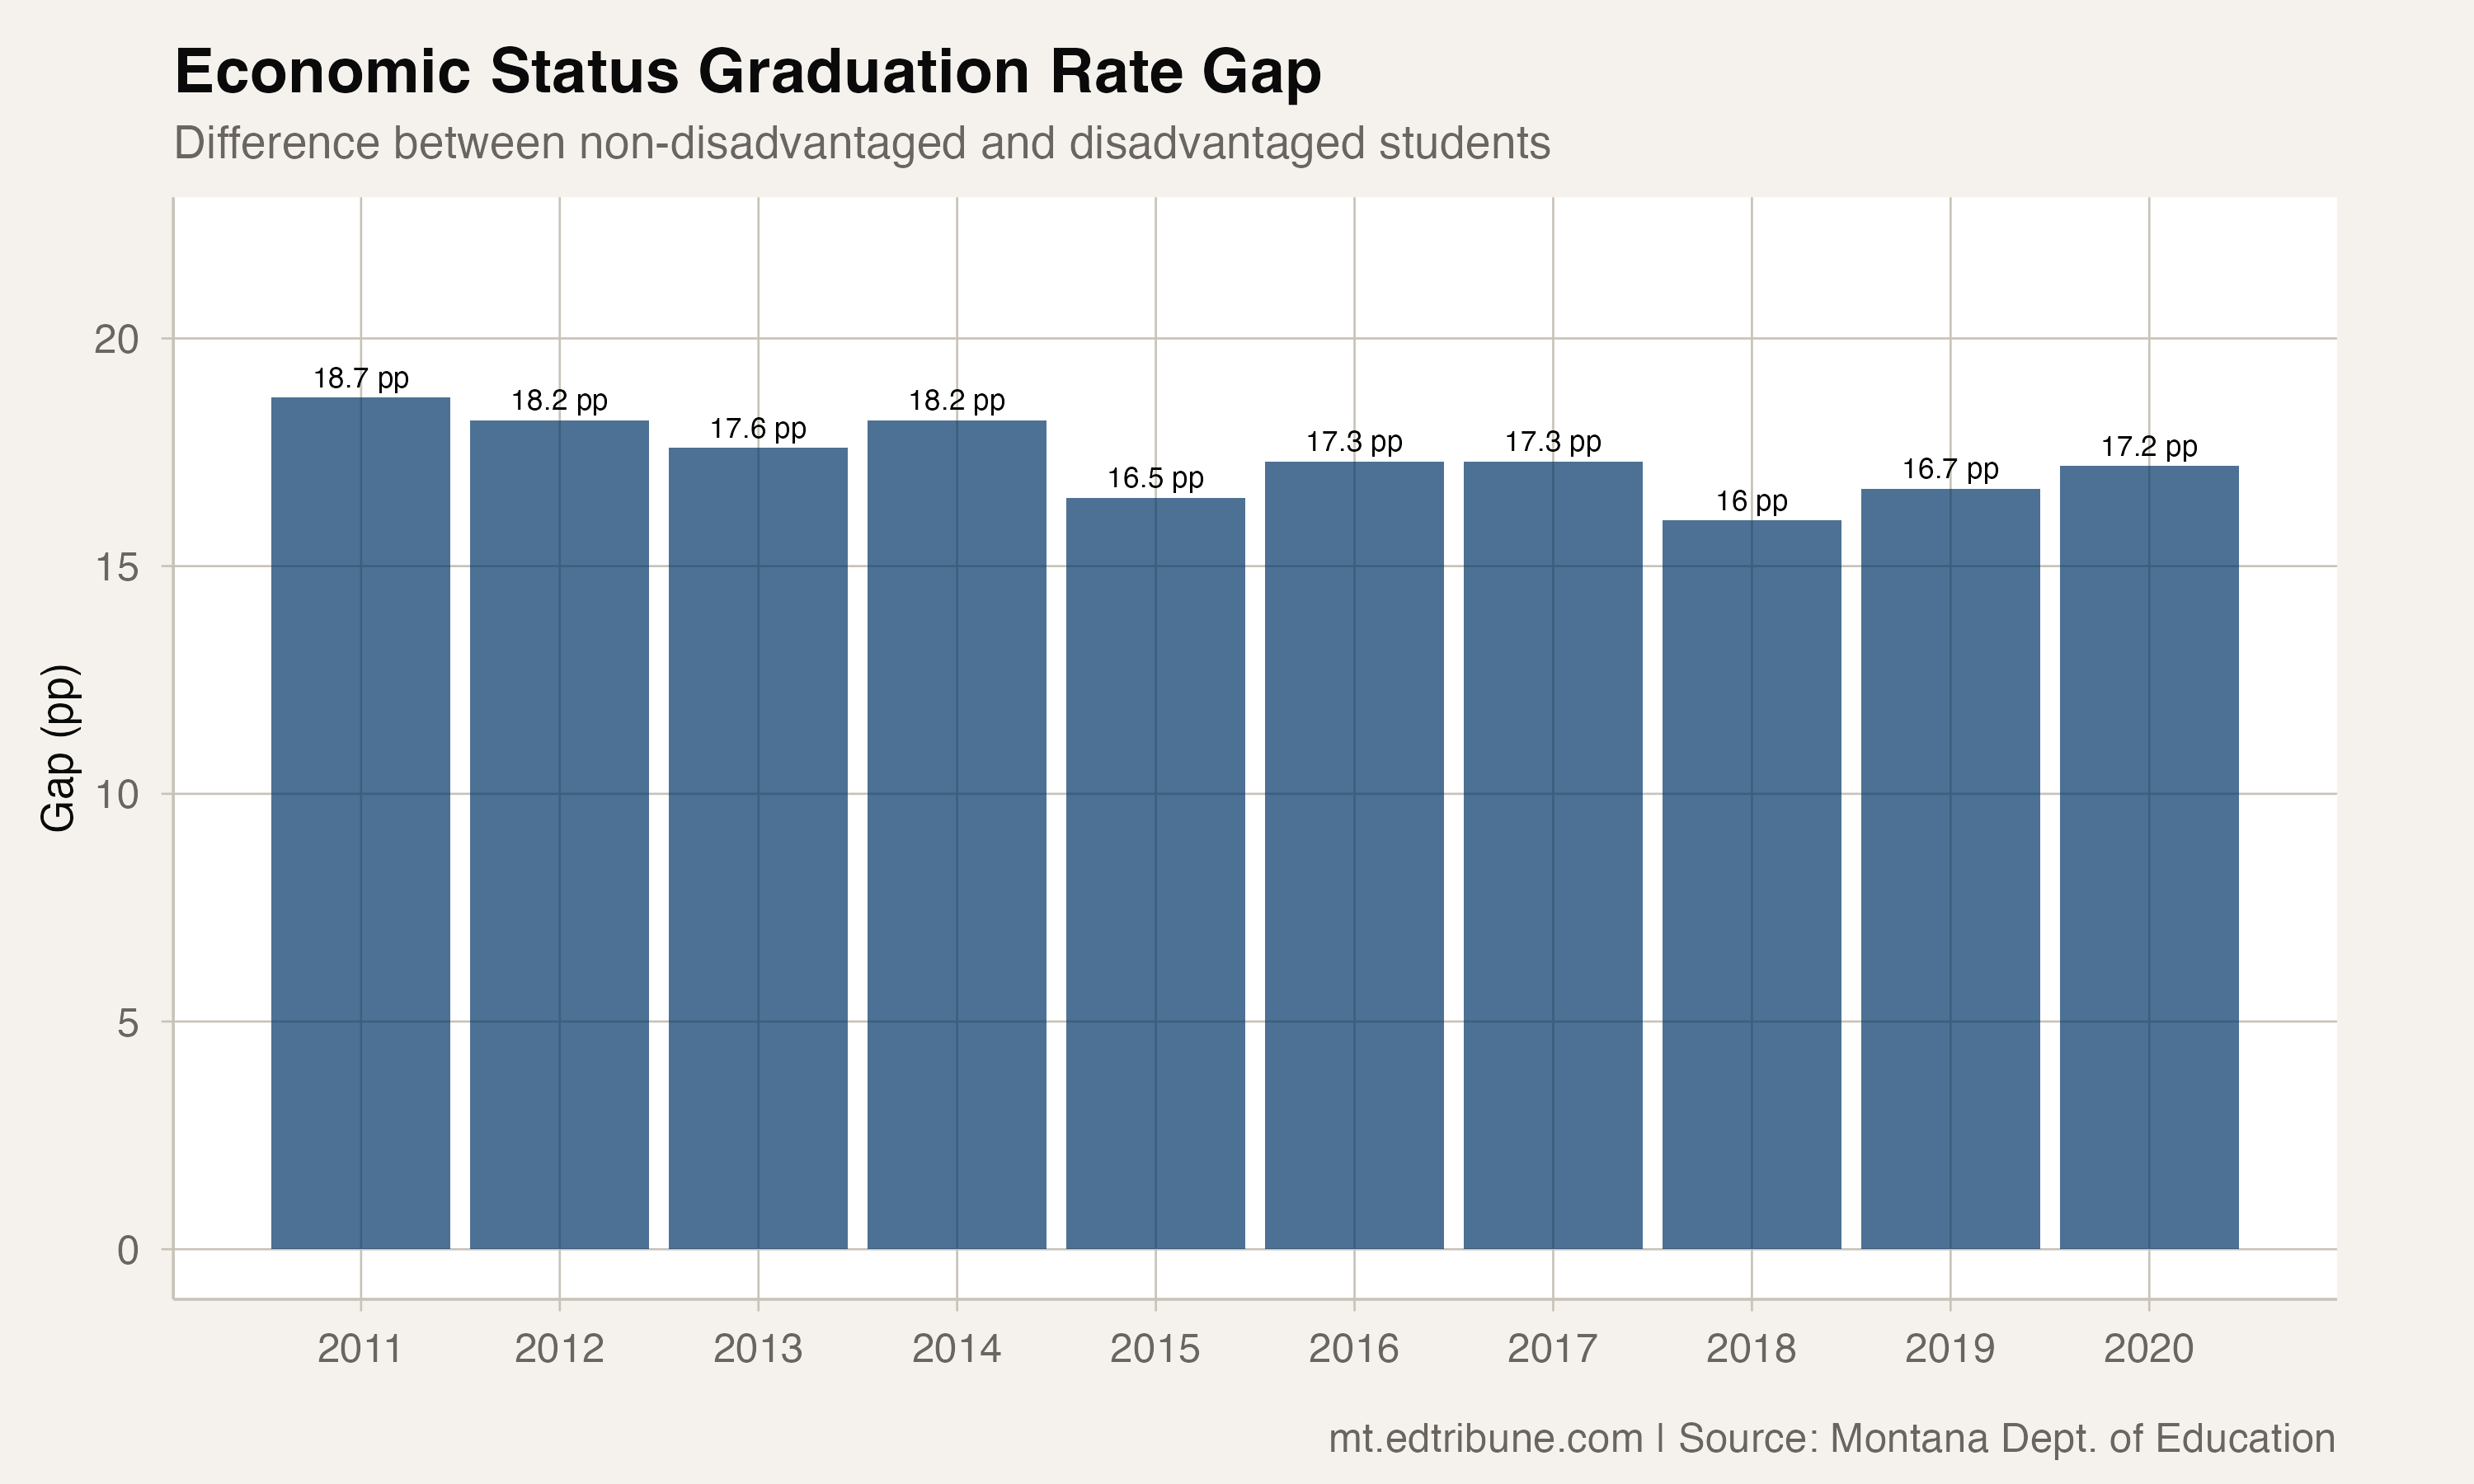
From 2018 to 2020, the economically disadvantaged rate fell from 78.0% to 76.8%, a 1.2-point decline. The non-disadvantaged rate rounded to 94.0% in both years.
Both rates increased across the complete panel
From 2012 to 2020, the economically disadvantaged rate increased from 73.0% to 76.8%, a 3.8-point gain. The non-disadvantaged rate increased from 91.2% to 94.0%, a 2.8-point gain. Because both rates rose, their difference narrowed by 1.0 point from the first complete year to the last.
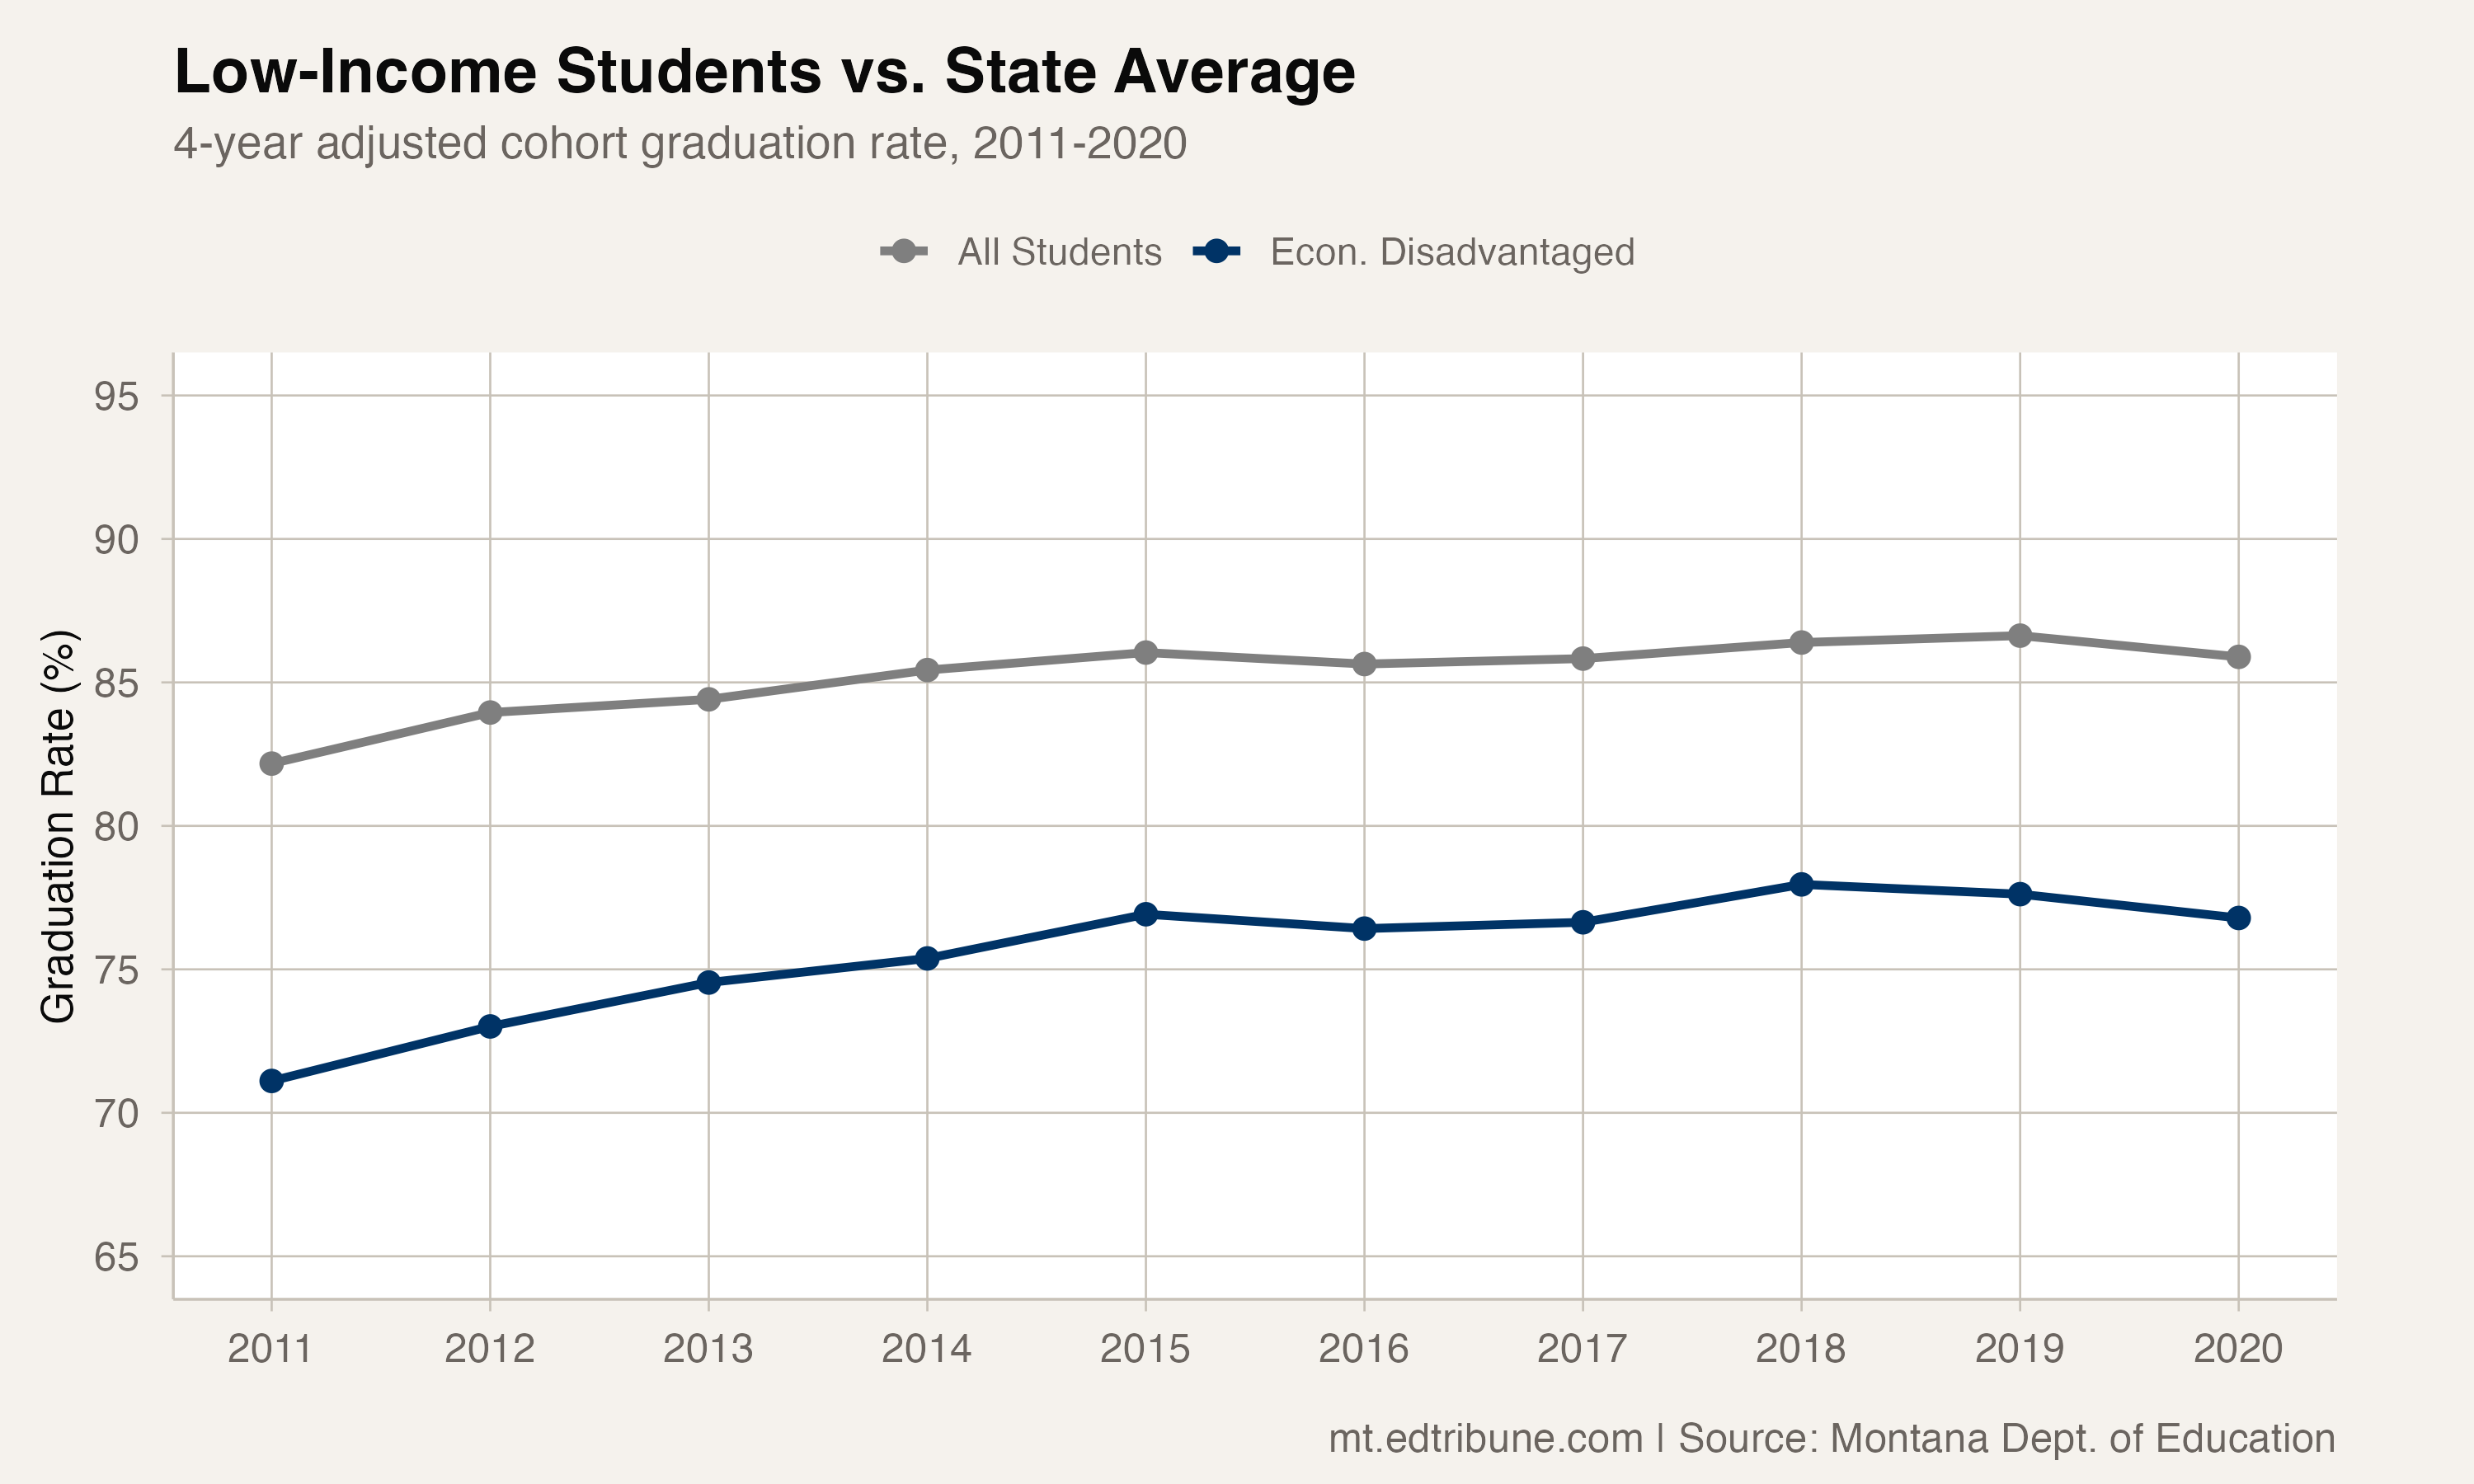
The 2020 statewide rate was 85.9%, 9.1 points above the economically disadvantaged rate and 8.1 points below the non-disadvantaged rate. Those comparisons describe the statewide series; they do not identify why the rates differ.
What the series supports
The package's statewide economic-status rows end in 2020, although its all-students series continues through 2024. This file therefore cannot show whether the economic-status gap widened, narrowed or held steady after 2020. It also cannot establish how school quality, funding, policy or student composition caused the observed differences.
Analysis uses four-year adjusted cohort graduation-rate rows sourced from the Montana Office of Public Instruction. The audited economic-status comparison is limited to the nine years with both statewide values, 2012 through 2020.
Detailed code that reproduces the analysis and figures in this article is available exclusively to EdTribune subscribers.
Discussion
Sign in to join the discussion.
Loading comments...