Montana's Native American graduation rate reached 69.2% in 2021, the highest on record. It was the culmination of a slow, uneven climb from 61.5% in 2012 -- nearly eight percentage points of progress accumulated over nine years.
Two years later, the rate had dropped to 66.1%, below where it stood in 2017. Six years of gains, gone.
The peak that didn't hold
The 2021 rate of 69.2% was significant because it was the highest Native American graduation rate in Montana's data record. It was the second consecutive year of improvement after a volatile stretch. It looked, briefly, like the beginning of sustained progress.
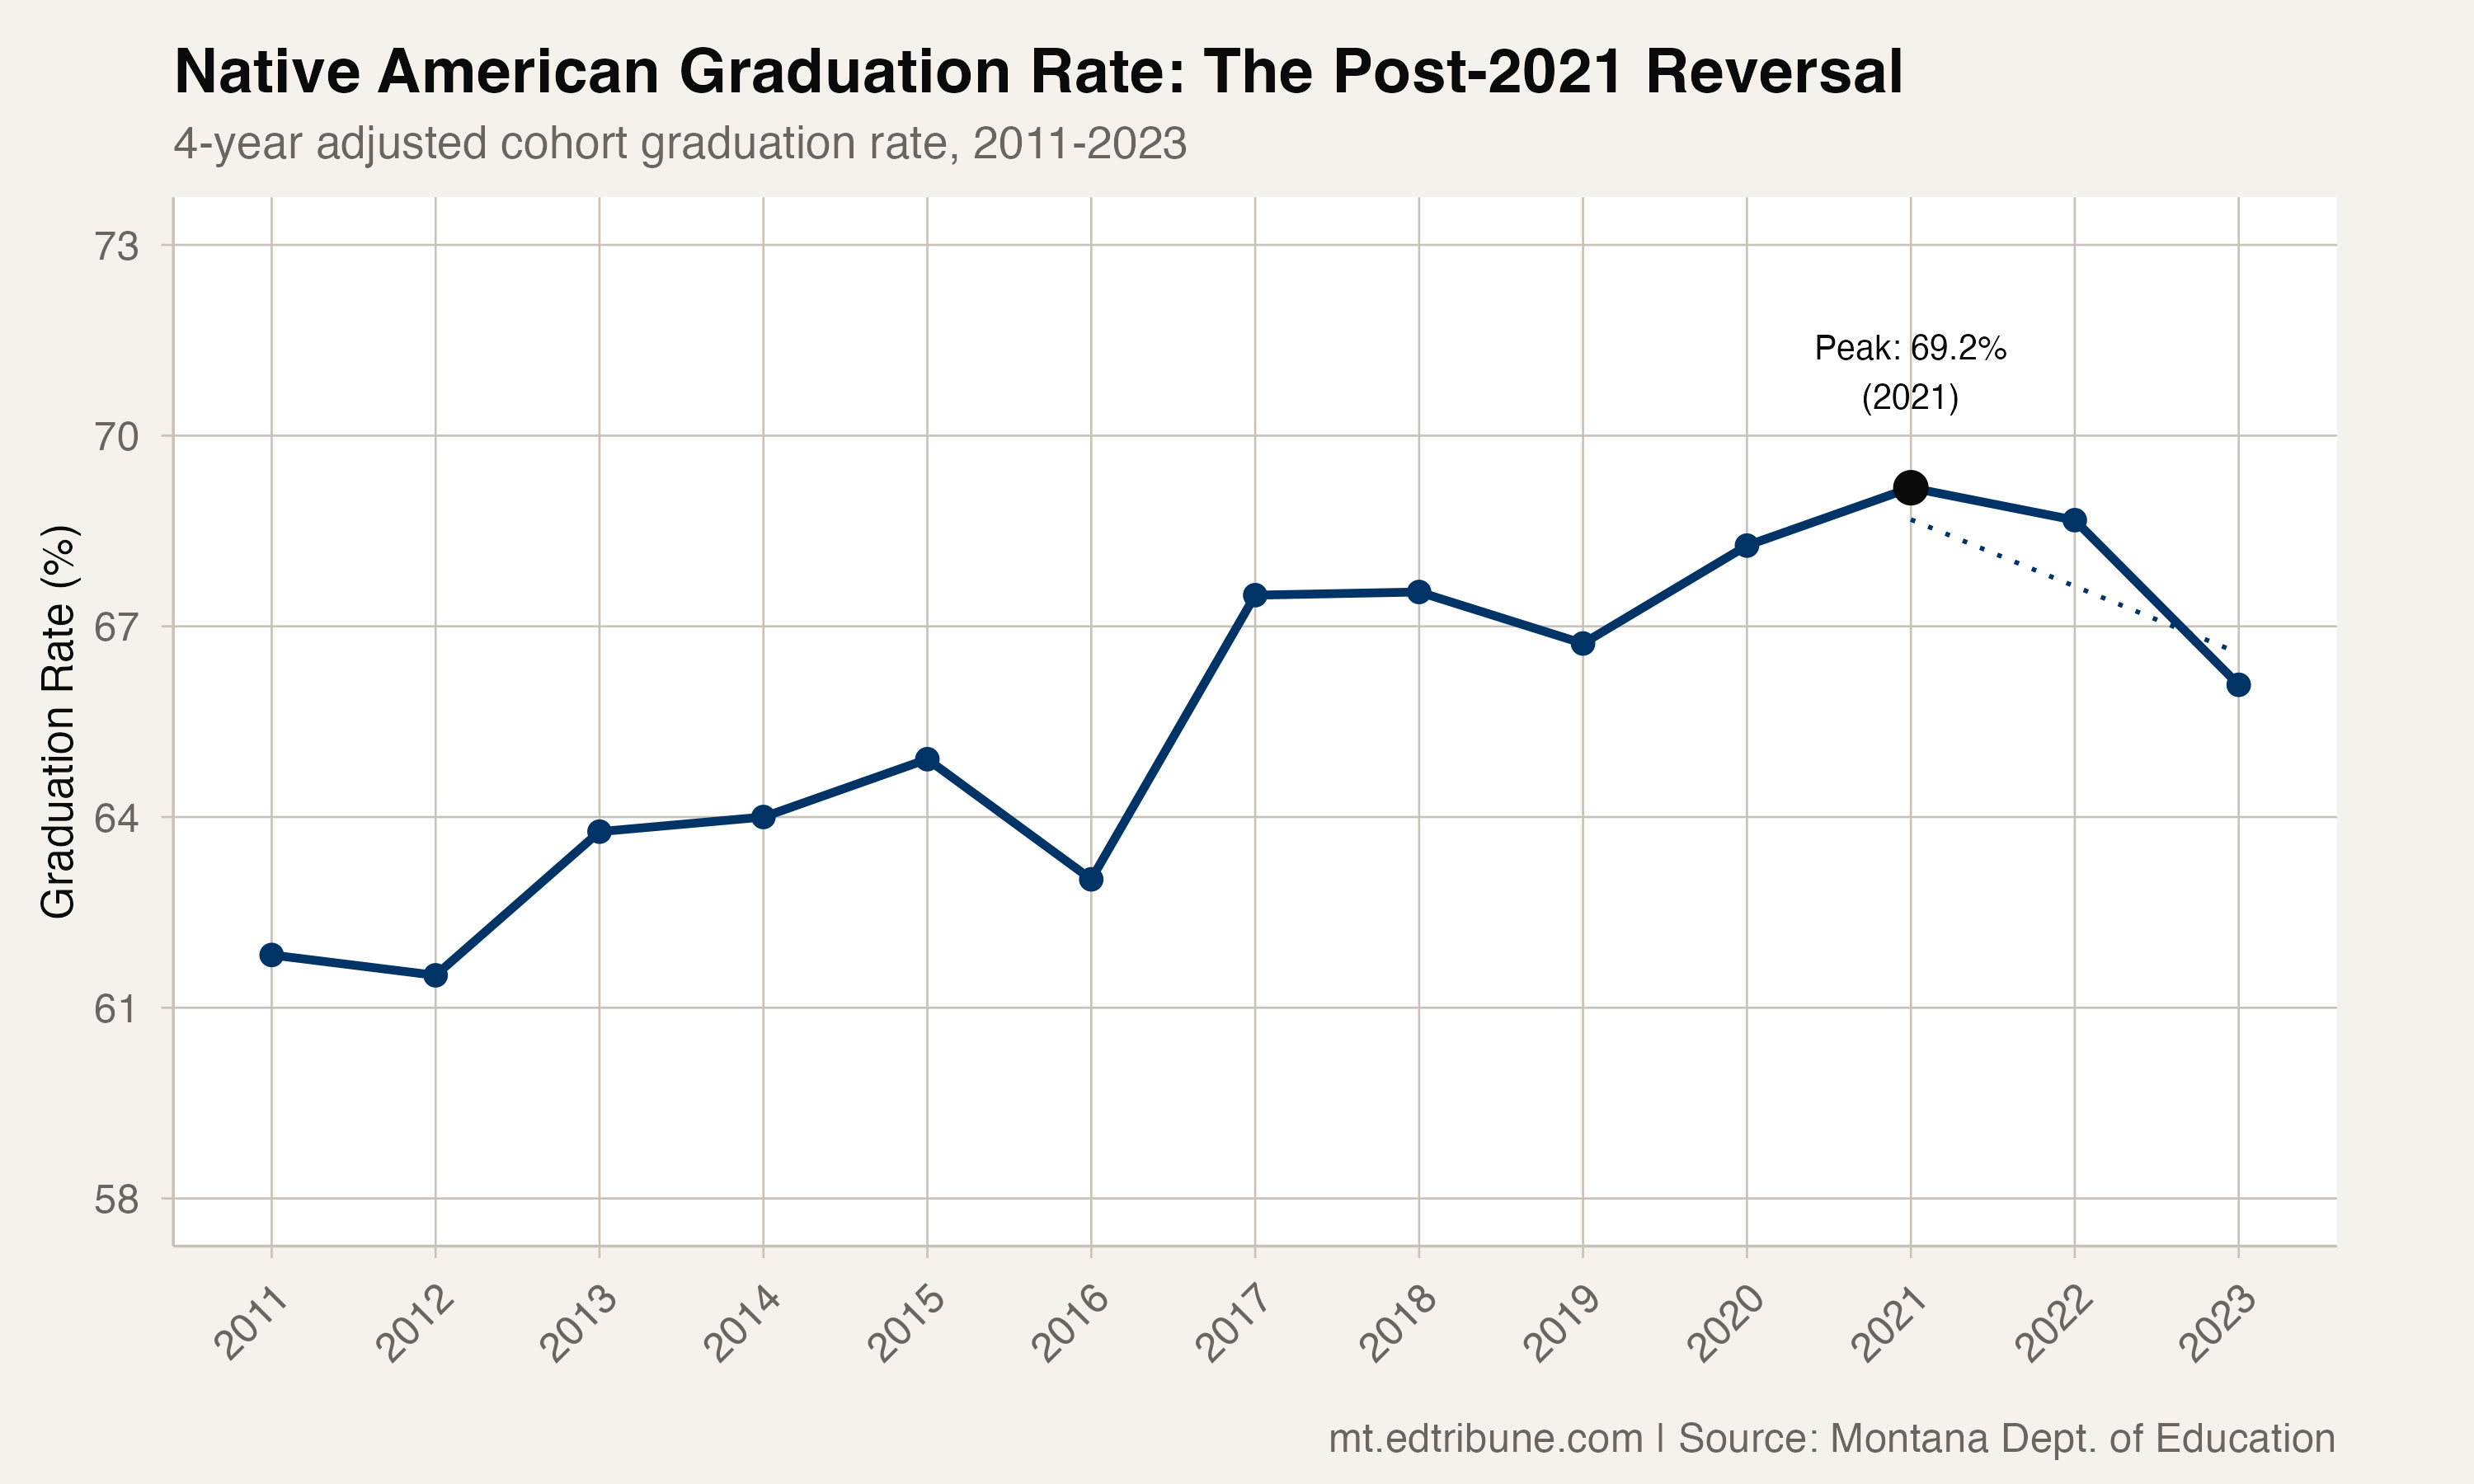
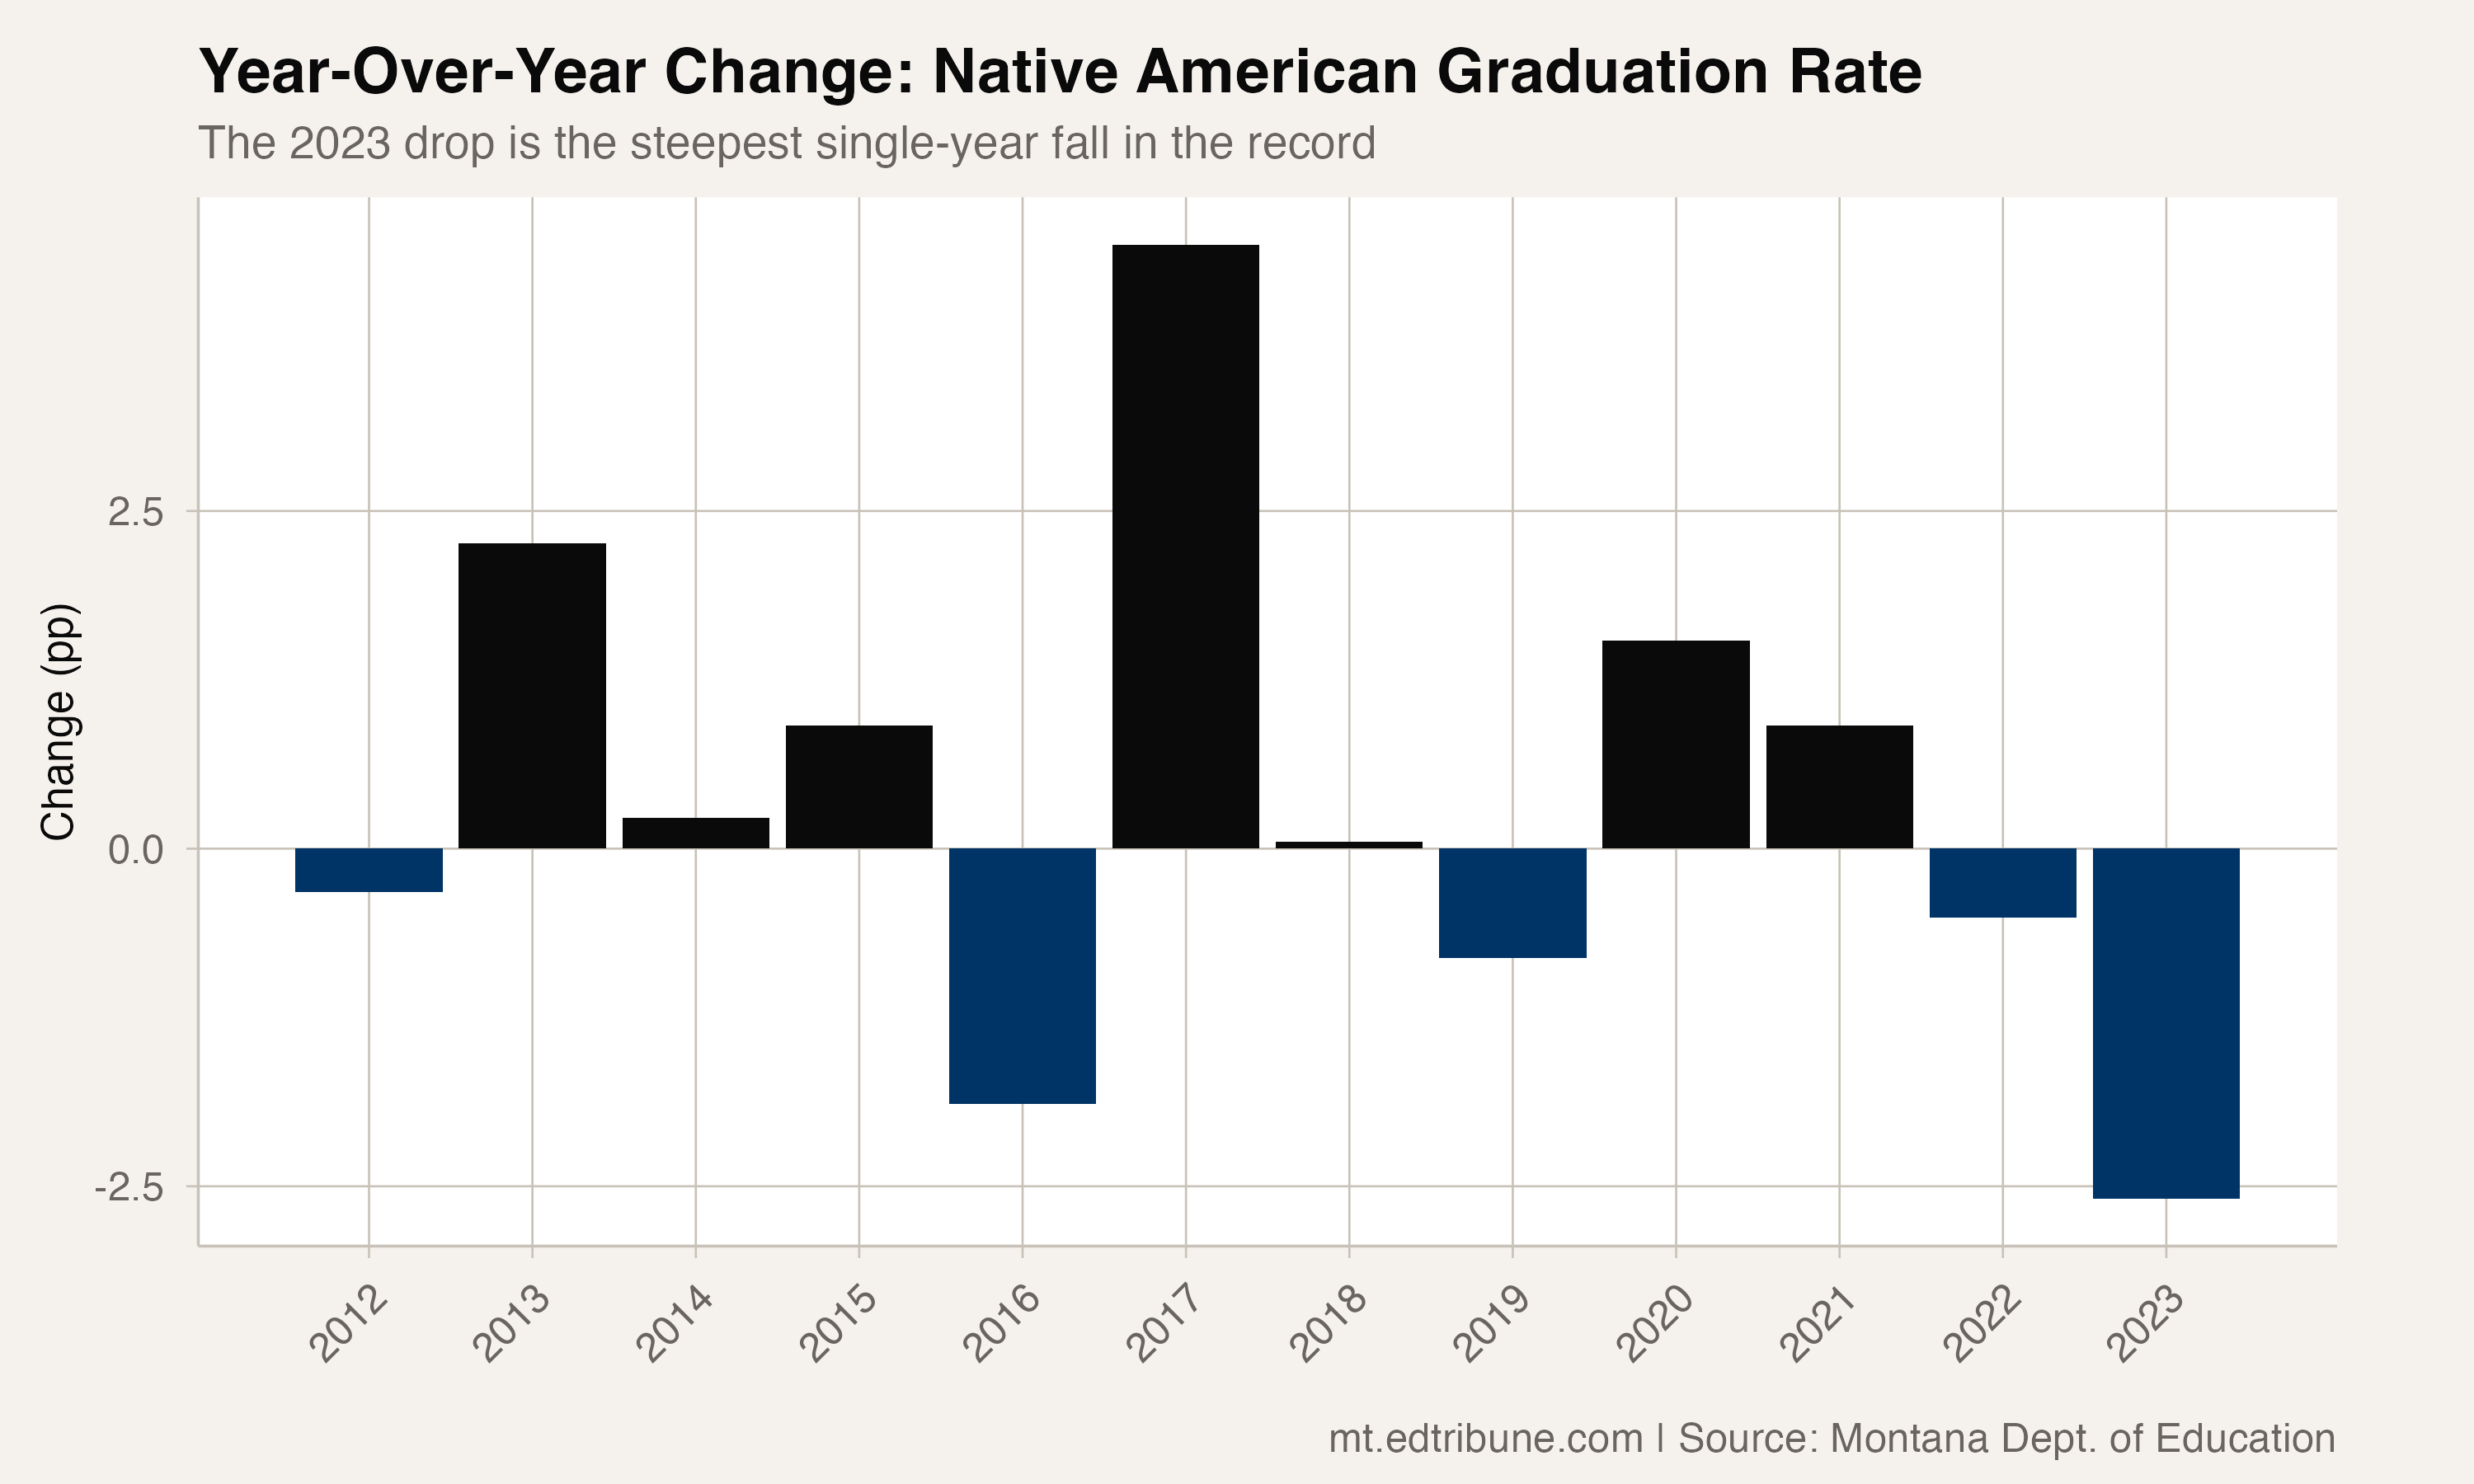
Then the rate dropped half a point in 2022, to 68.7%. Then it dropped 2.6 points in 2023, to 66.1%. The 2023 decline was the steepest single-year drop in the data record, ahead of the 1.9-point fall in 2016.
The trajectory from peak to 2023 wiped out every gain recorded since 2017. In two years, the rate fell below all six preceding years, to its lowest point since 2016.
A disproportionate impact
The overall state graduation rate also declined during this period, but the magnitude was strikingly different. From 2021 to 2023, the all-students rate fell from 86.1% to 85.6% -- a decline of 0.5 points. The Native American rate fell 3.1 points over the same period, more than six times the state average decline.
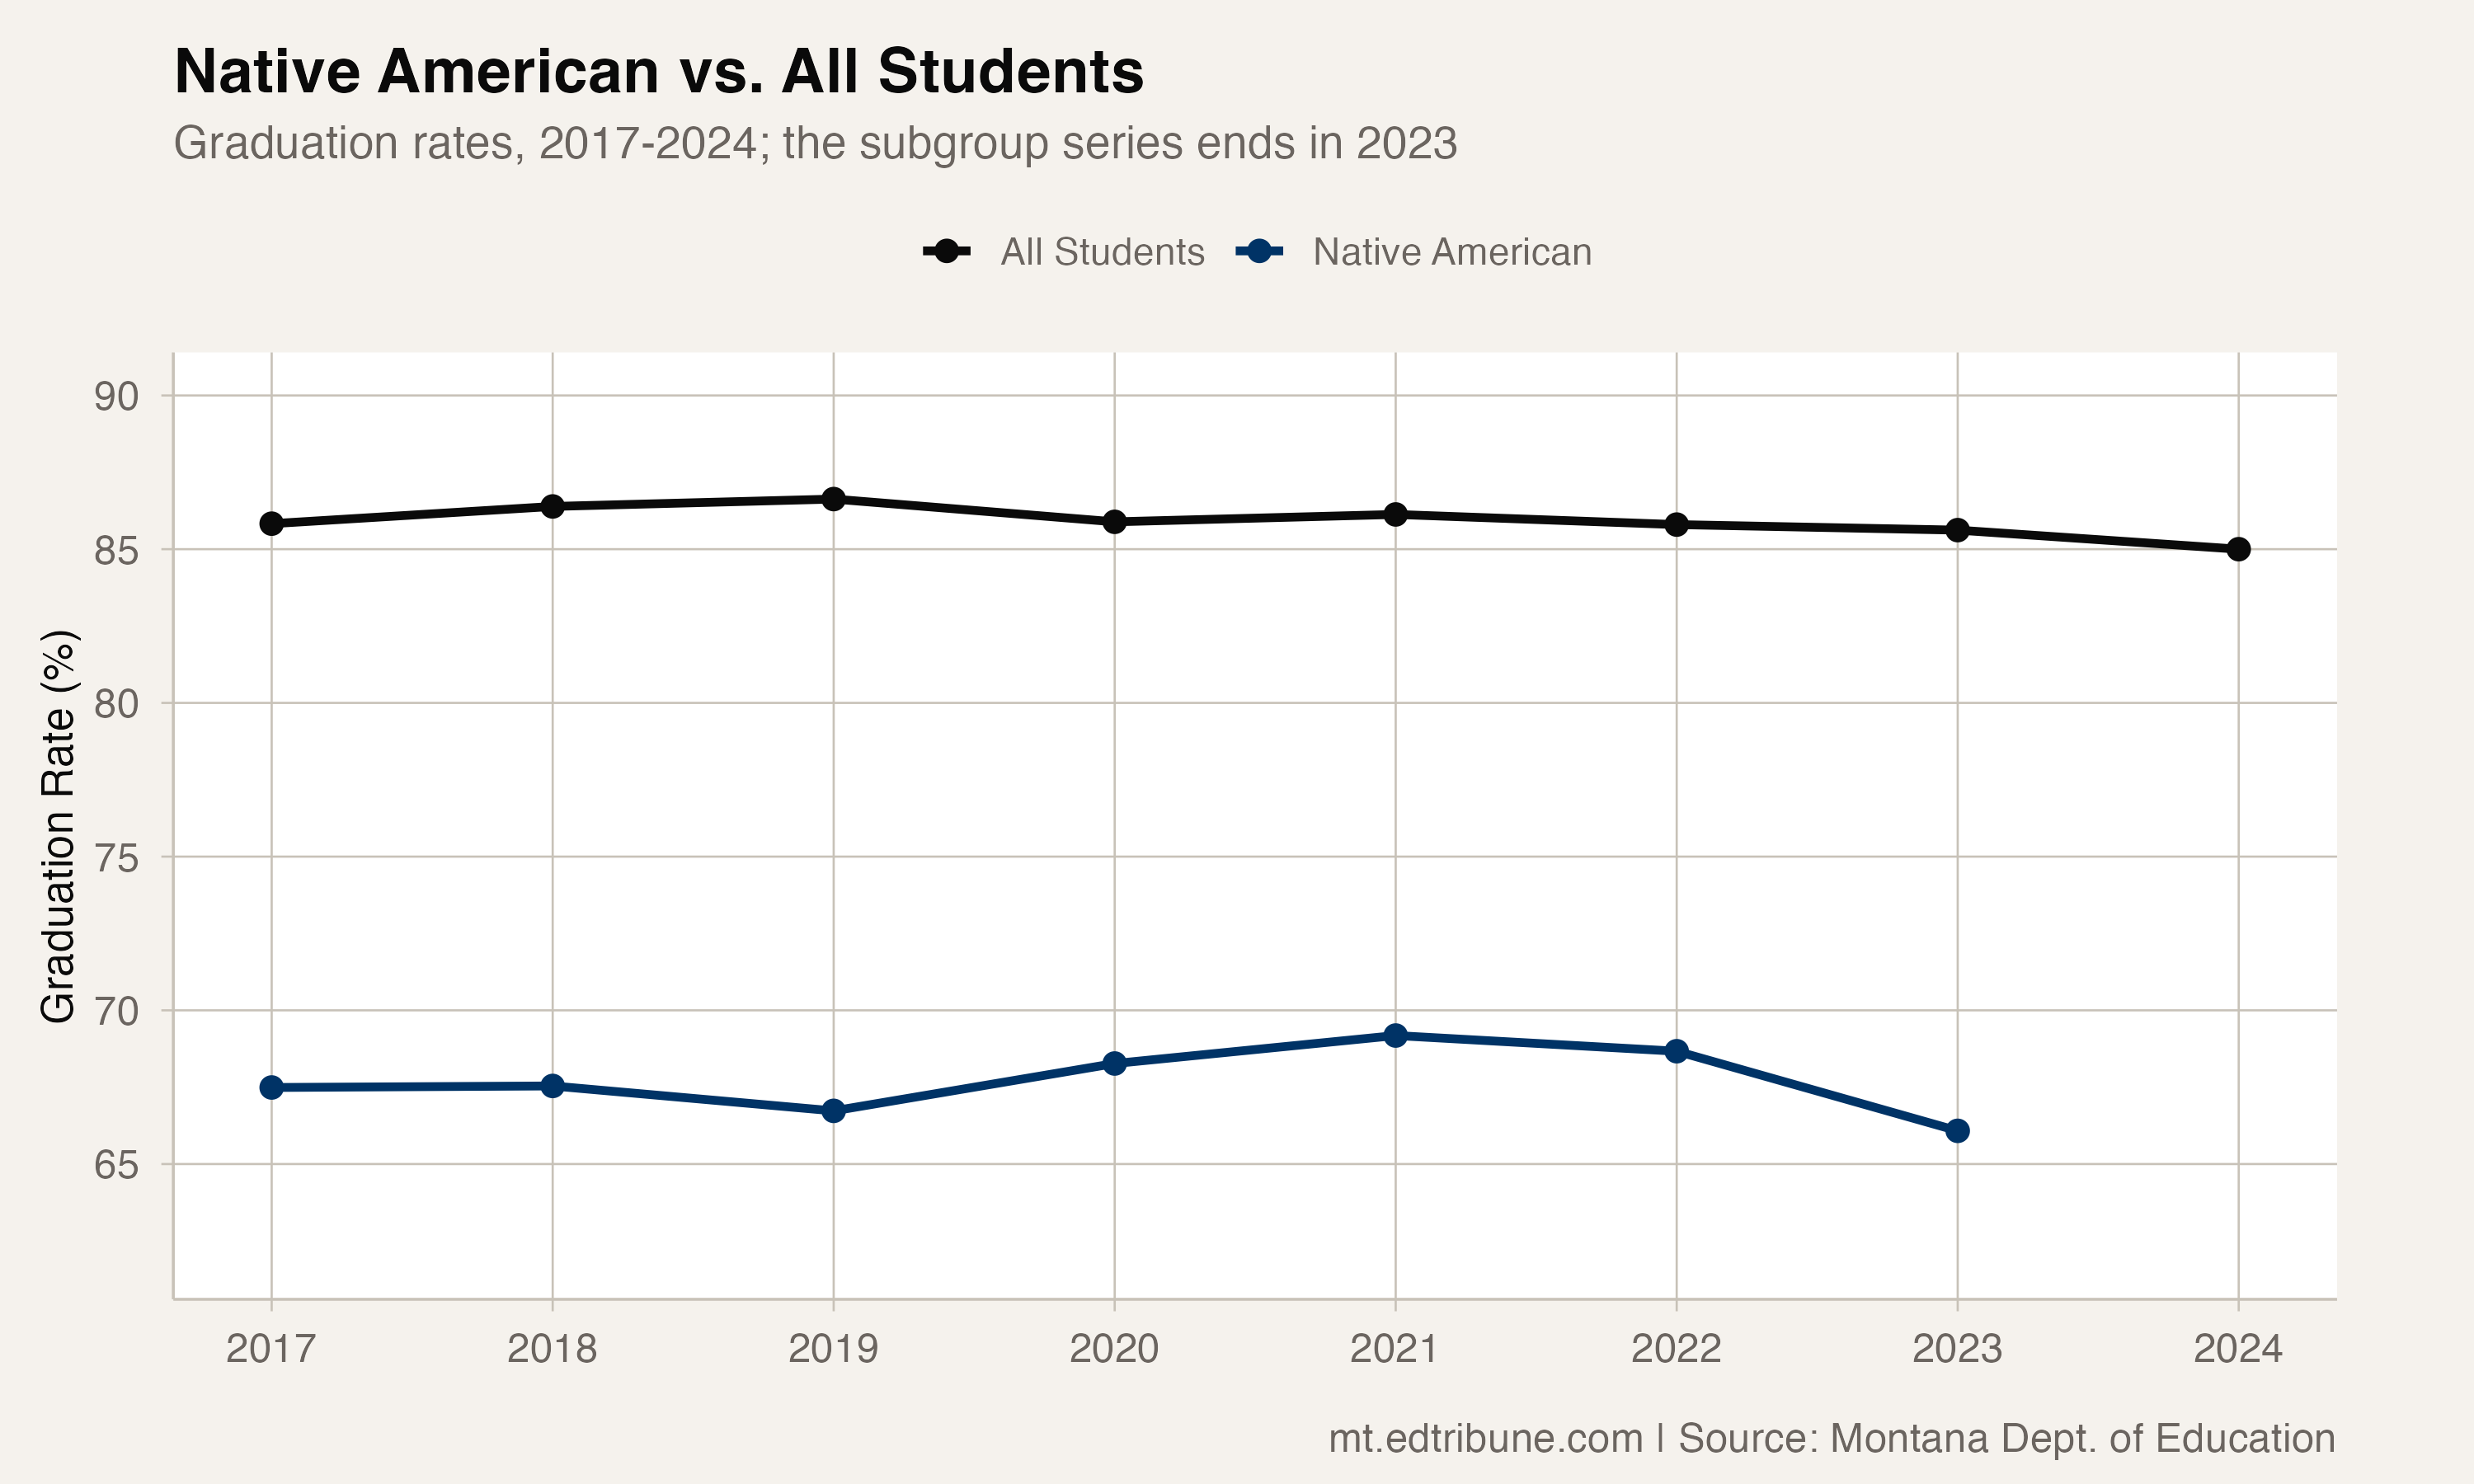
The gap between all students and Native American students widened from 16.9 points in 2021 to 19.5 points in 2023. That 2.6-point expansion in just two years undid about three-quarters of the 3.4 points of narrowing that had accumulated over the preceding decade.
The graduation data does not explain why the decline was steeper for one group than for the state as a whole. It shows only that two lines that had been converging for a decade moved apart after 2021, and that 2023 is the last year for which a Native American rate exists to measure.
The question of inflated peaks
There is an uncomfortable possibility embedded in the timing. The 2020 and 2021 graduation rates -- for all subgroups, not just Native American students -- were produced under pandemic-era policies that may have inflated outcomes. Credit recovery programs, flexible grading, and relaxed attendance requirements were widespread during the 2019-20 and 2020-21 school years.
If the 2020-2021 peak was partially a policy artifact, then the post-2021 decline may represent a return to baseline rather than a genuine reversal of progress. The Native American rate before the pandemic -- 66.7% in 2019 -- is only 0.6 points above the 2023 rate of 66.1%.
This framing does not make the 66.1% rate acceptable. It means the progress that appeared to be happening may have been smaller than it looked, and that the barriers standing between one in three Native American students and an on-time diploma remain firmly in place.
Where the data goes dark
The 2024 OPI release carries only the all-students graduation rate (85.0%). No Native American rate appears in it. It is possible that the decline has continued, stabilized, or reversed, and the published data offers no way to tell.
The breakdowns have been thinning for years. OPI published sixteen student groups a year through 2020: race and ethnicity categories, gender, income, English learner status, and disability status. From 2021 it published four, all students plus female, male, and American Indian or Alaska Native. The 2024 release published one. As the breakdowns shrink, the populations with the largest gaps are the first to disappear from view.
Graduation-rate figures come from the Montana Office of Public Instruction, which reports this student group as American Indian or Alaska Native.
Detailed code that reproduces the analysis and figures in this article is available exclusively to EdTribune subscribers.
Discussion
Sign in to join the discussion.
Loading comments...