Correction (July 21, 2026): This article previously combined the graduation-rate file with funding, legal, dropout, causal, district and long-range parity claims that the executed state package could not verify. This version removes those claims, limits White-Native comparisons to years with both values and rebuilds all charts from current Montana OPI graduation data.
Montana's latest year with both White and Native American statewide graduation rates is 2020. The four-year adjusted cohort graduation rate was 88.7% for White students and 68.3% for Native American students, a 20.4-percentage-point difference.
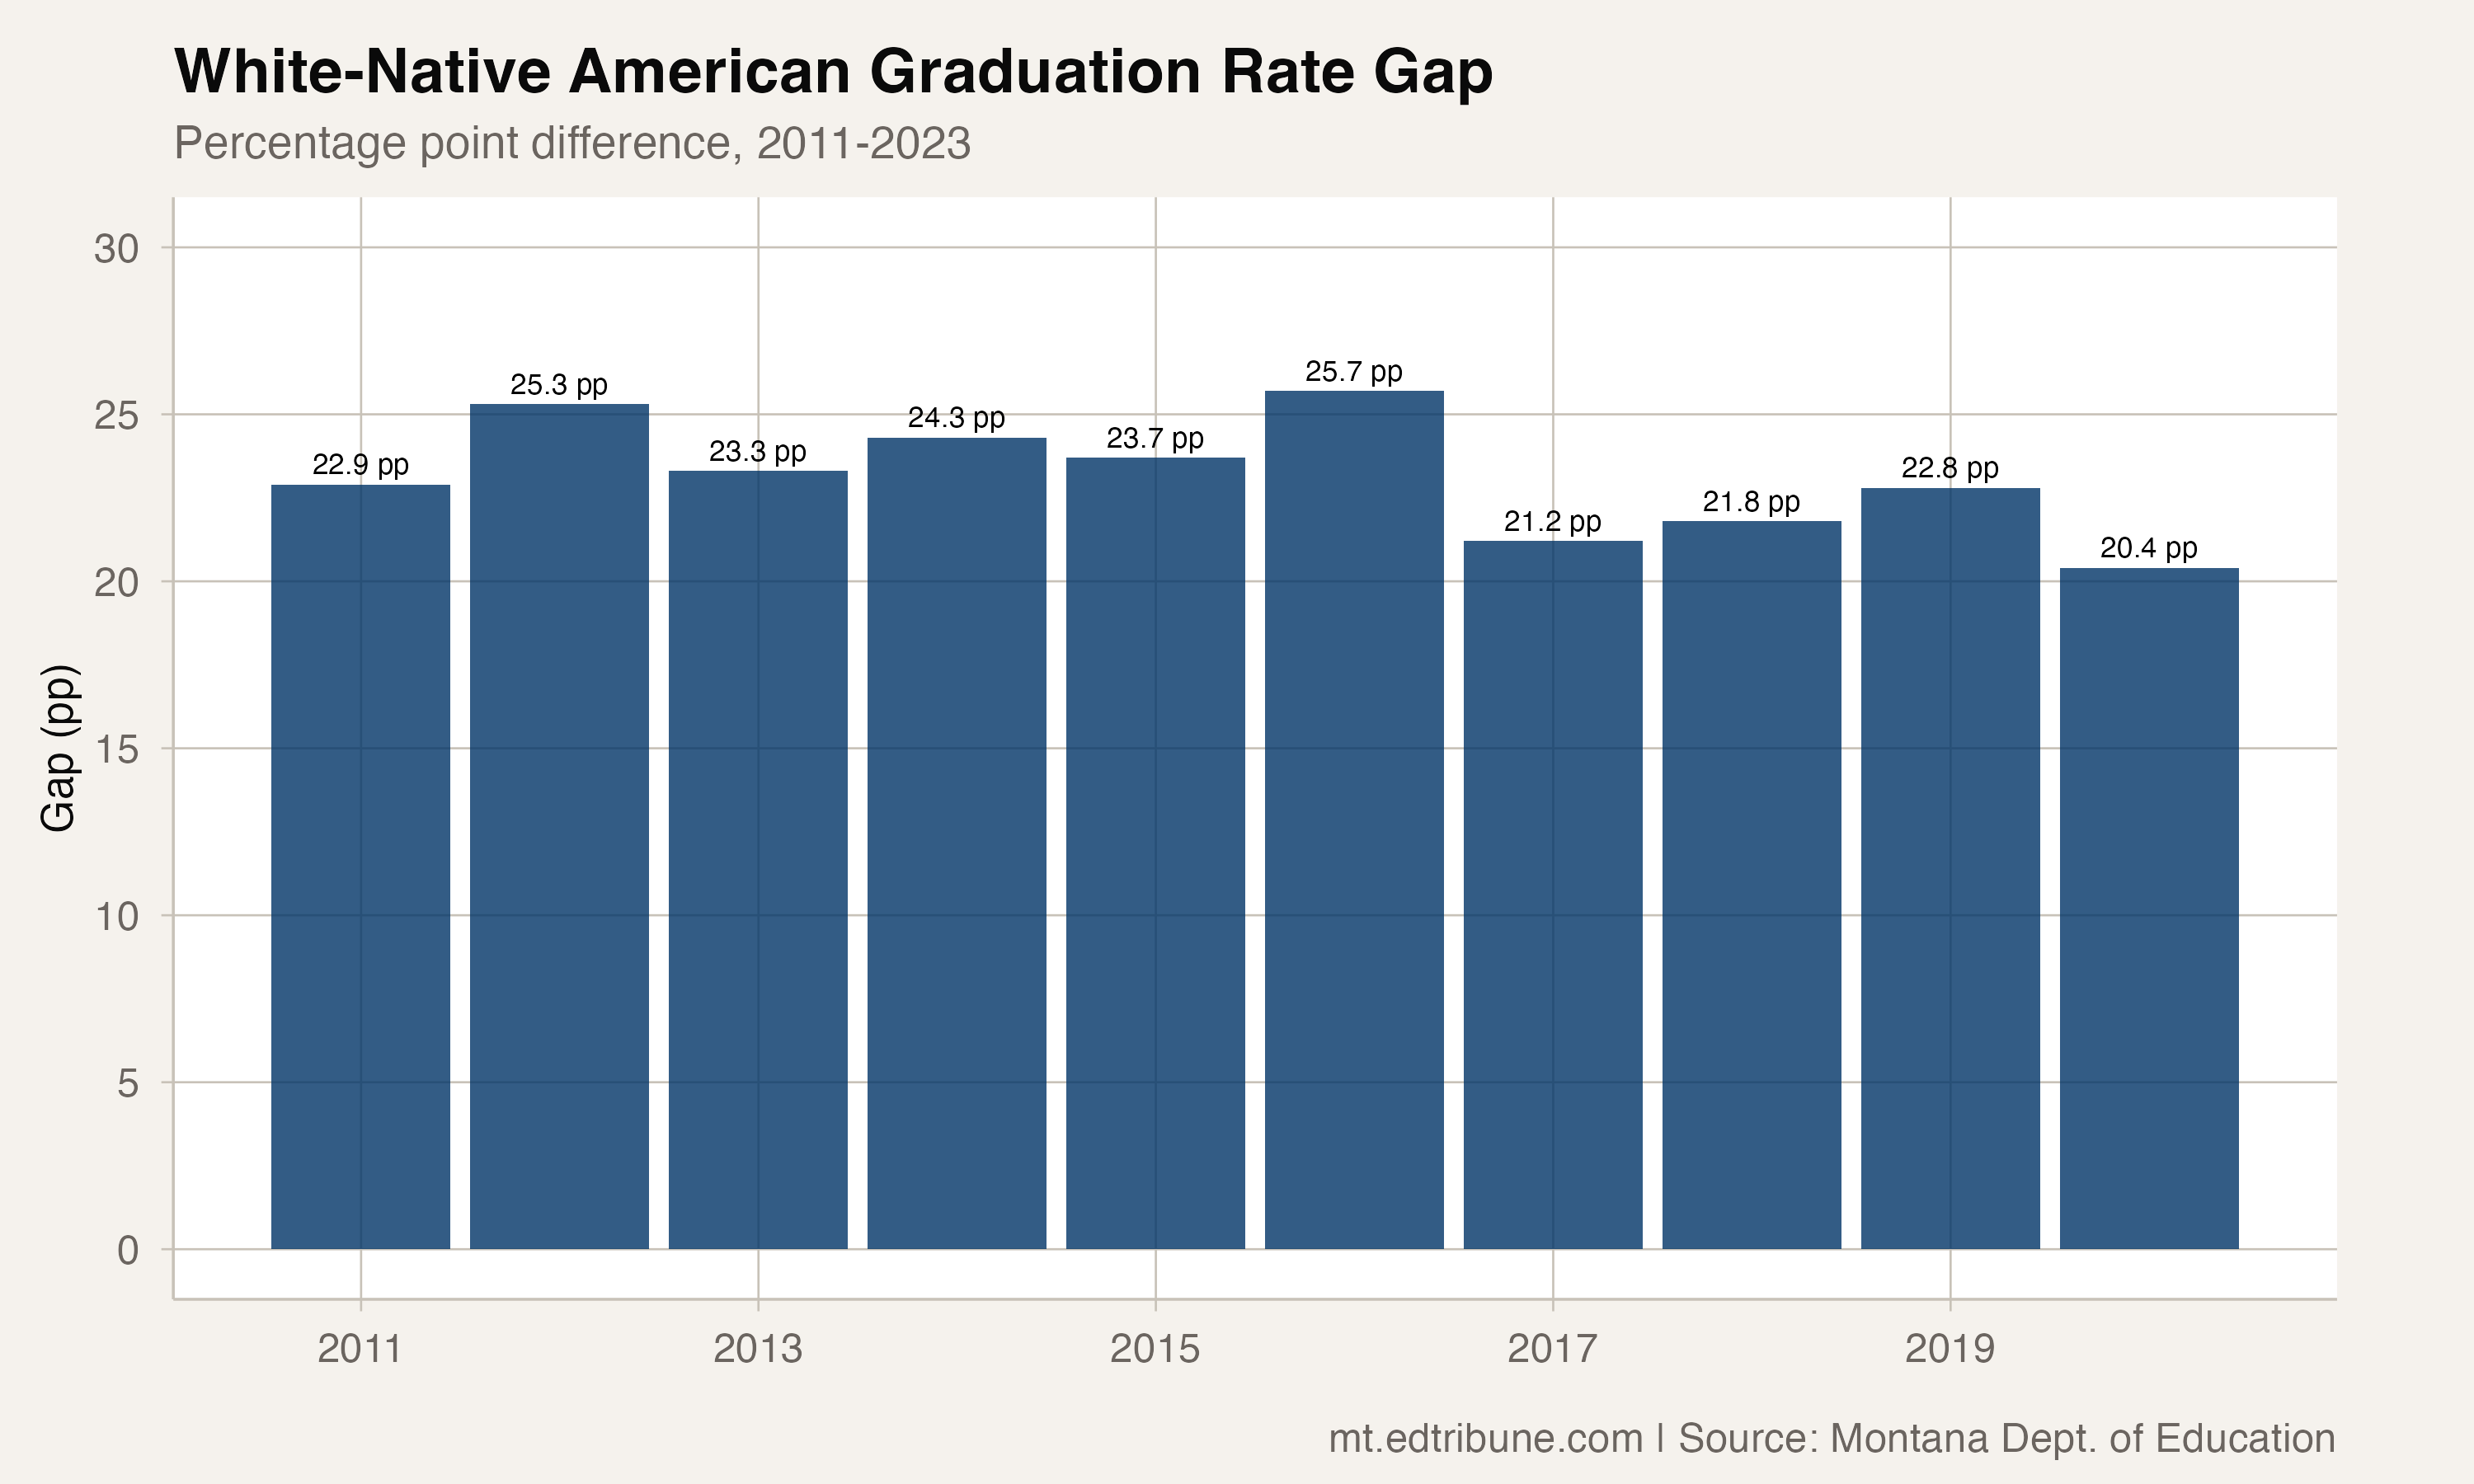
Across the ten complete years from 2011 through 2020, the White-Native American gap never fell below 20 points. It ranged from 20.4 points in 2020 to 25.7 points in 2016.
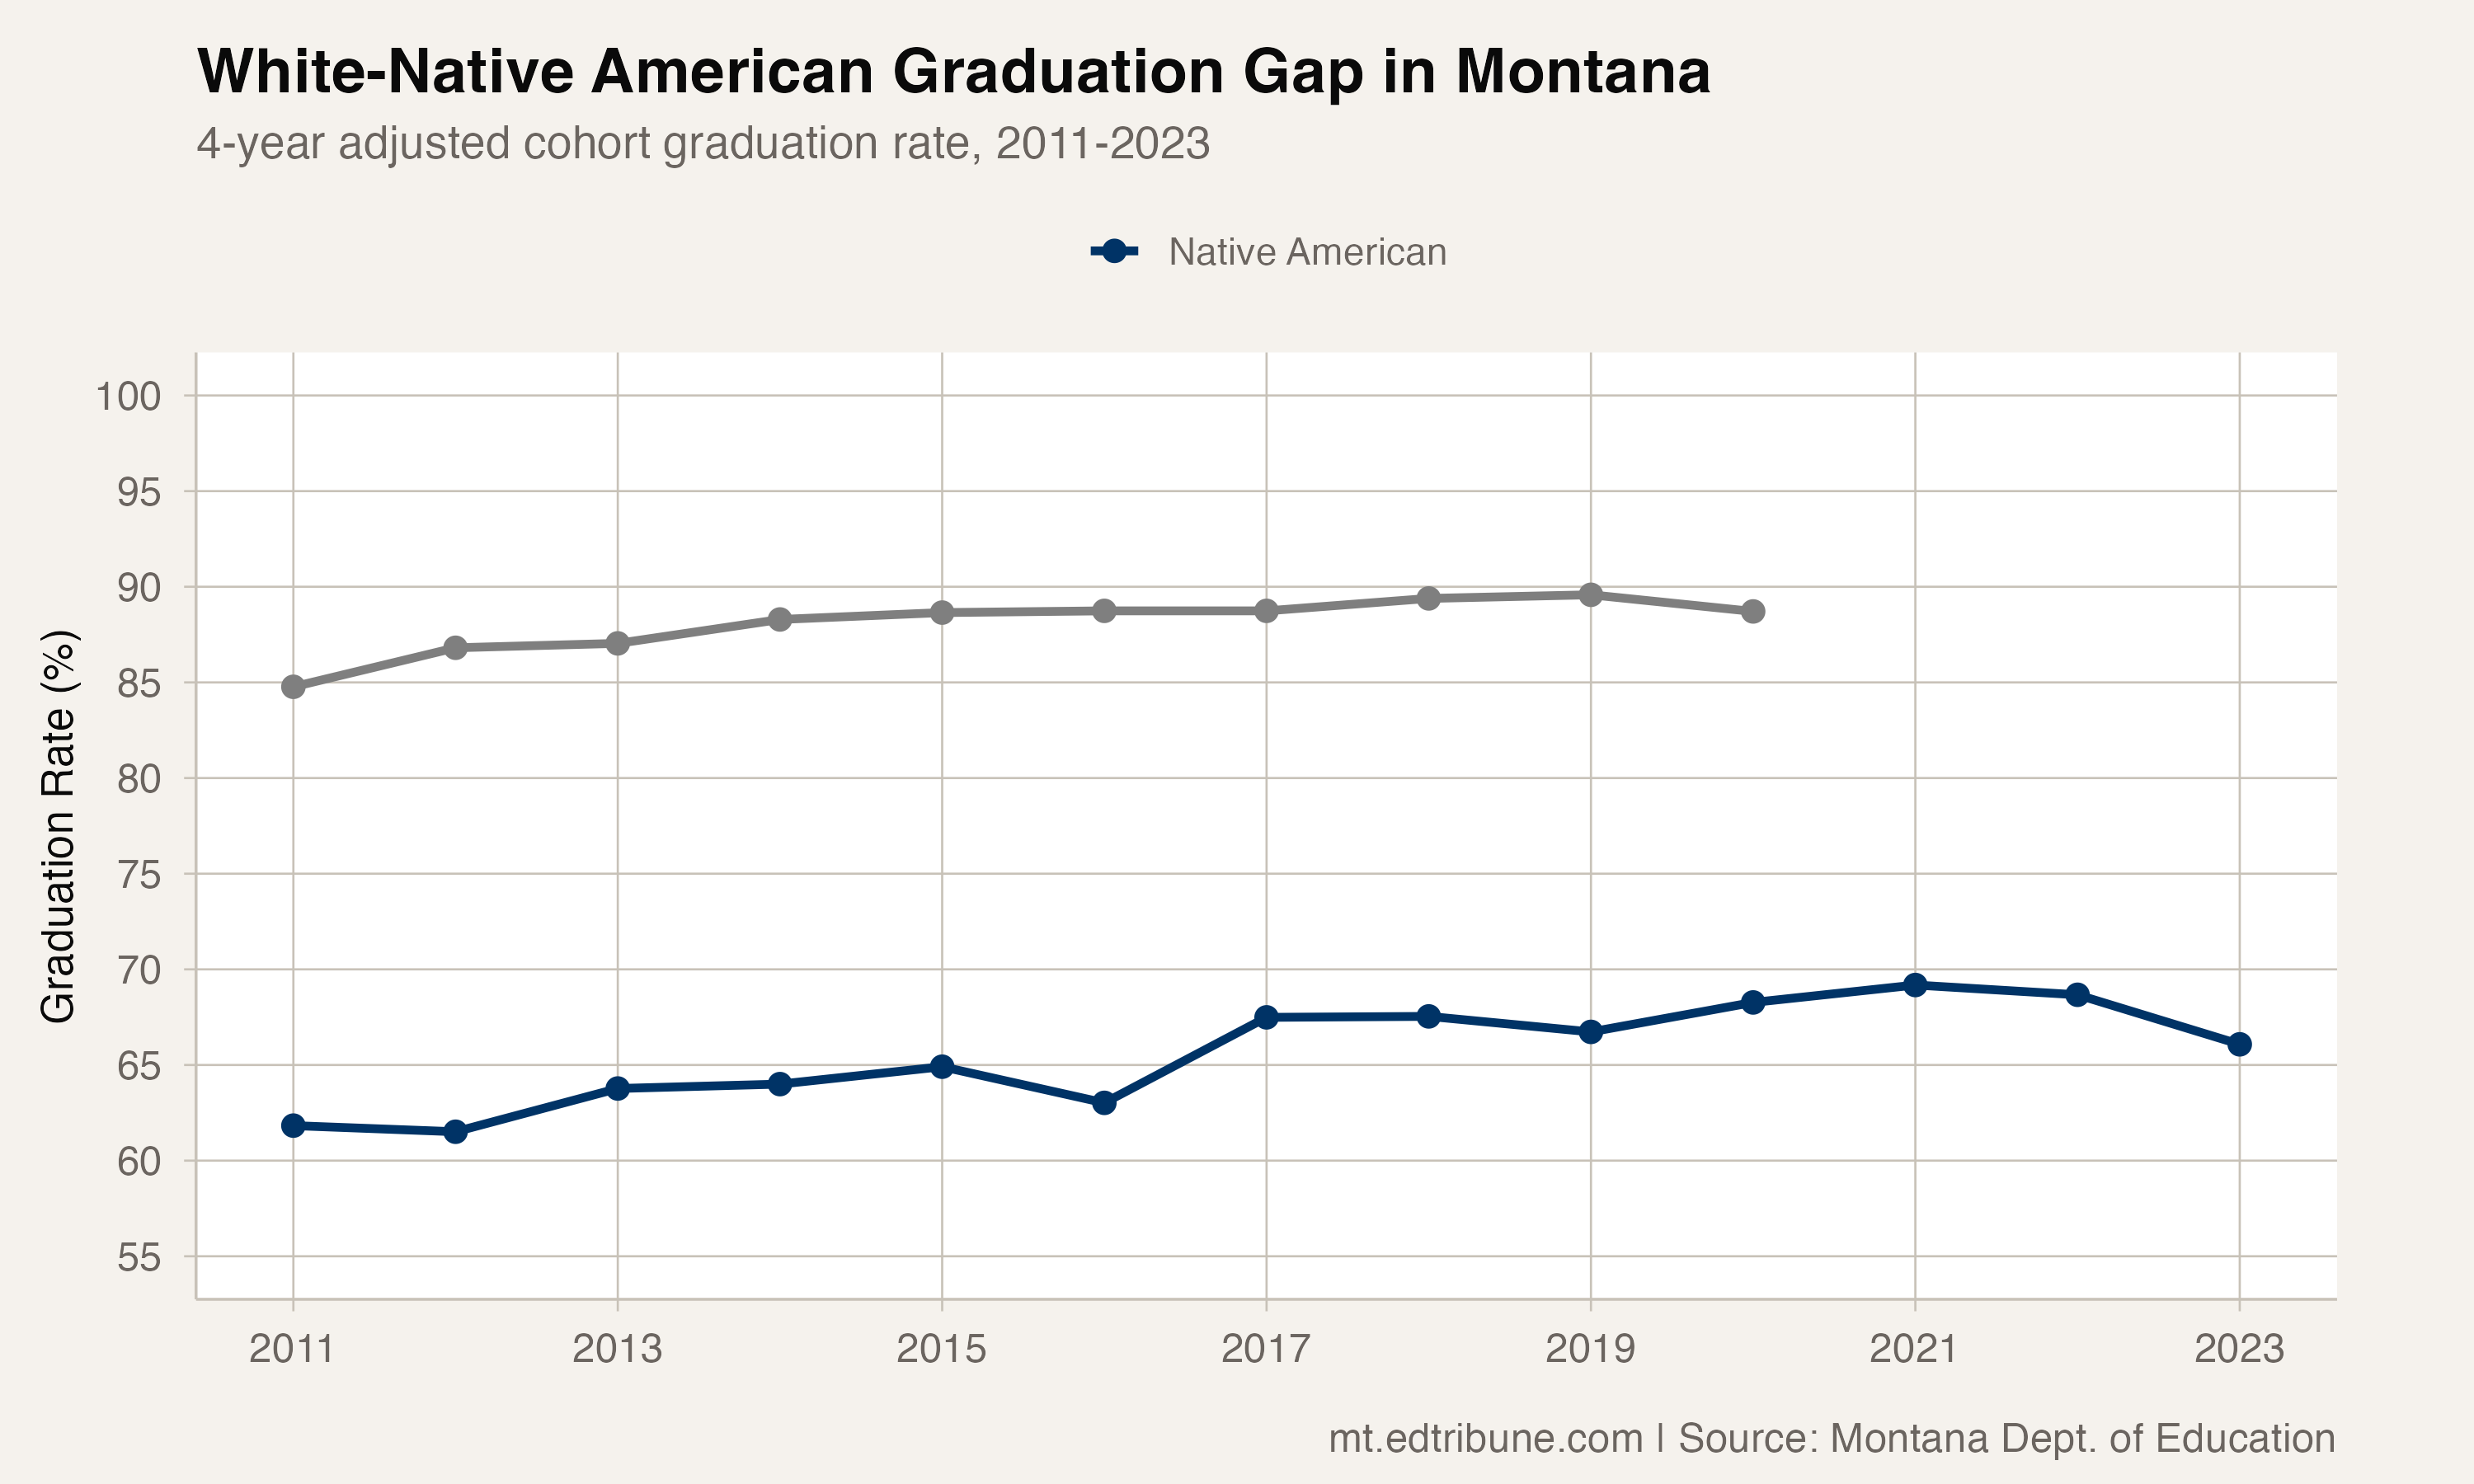
The Native American rate fell after 2021
The package continues to report a Native American statewide rate after the White series ends. That rate reached 69.2% in 2021, then fell to 68.7% in 2022 and 66.1% in 2023. The two-year change was a 3.1-point decline.
The all-students comparison moved in the same direction over those two years. The difference between the all-students and Native American rates increased from 16.9 points in 2021 to 19.5 points in 2023, a 2.6-point increase. Because the White rate is absent after 2020, those figures do not extend the White-Native series.
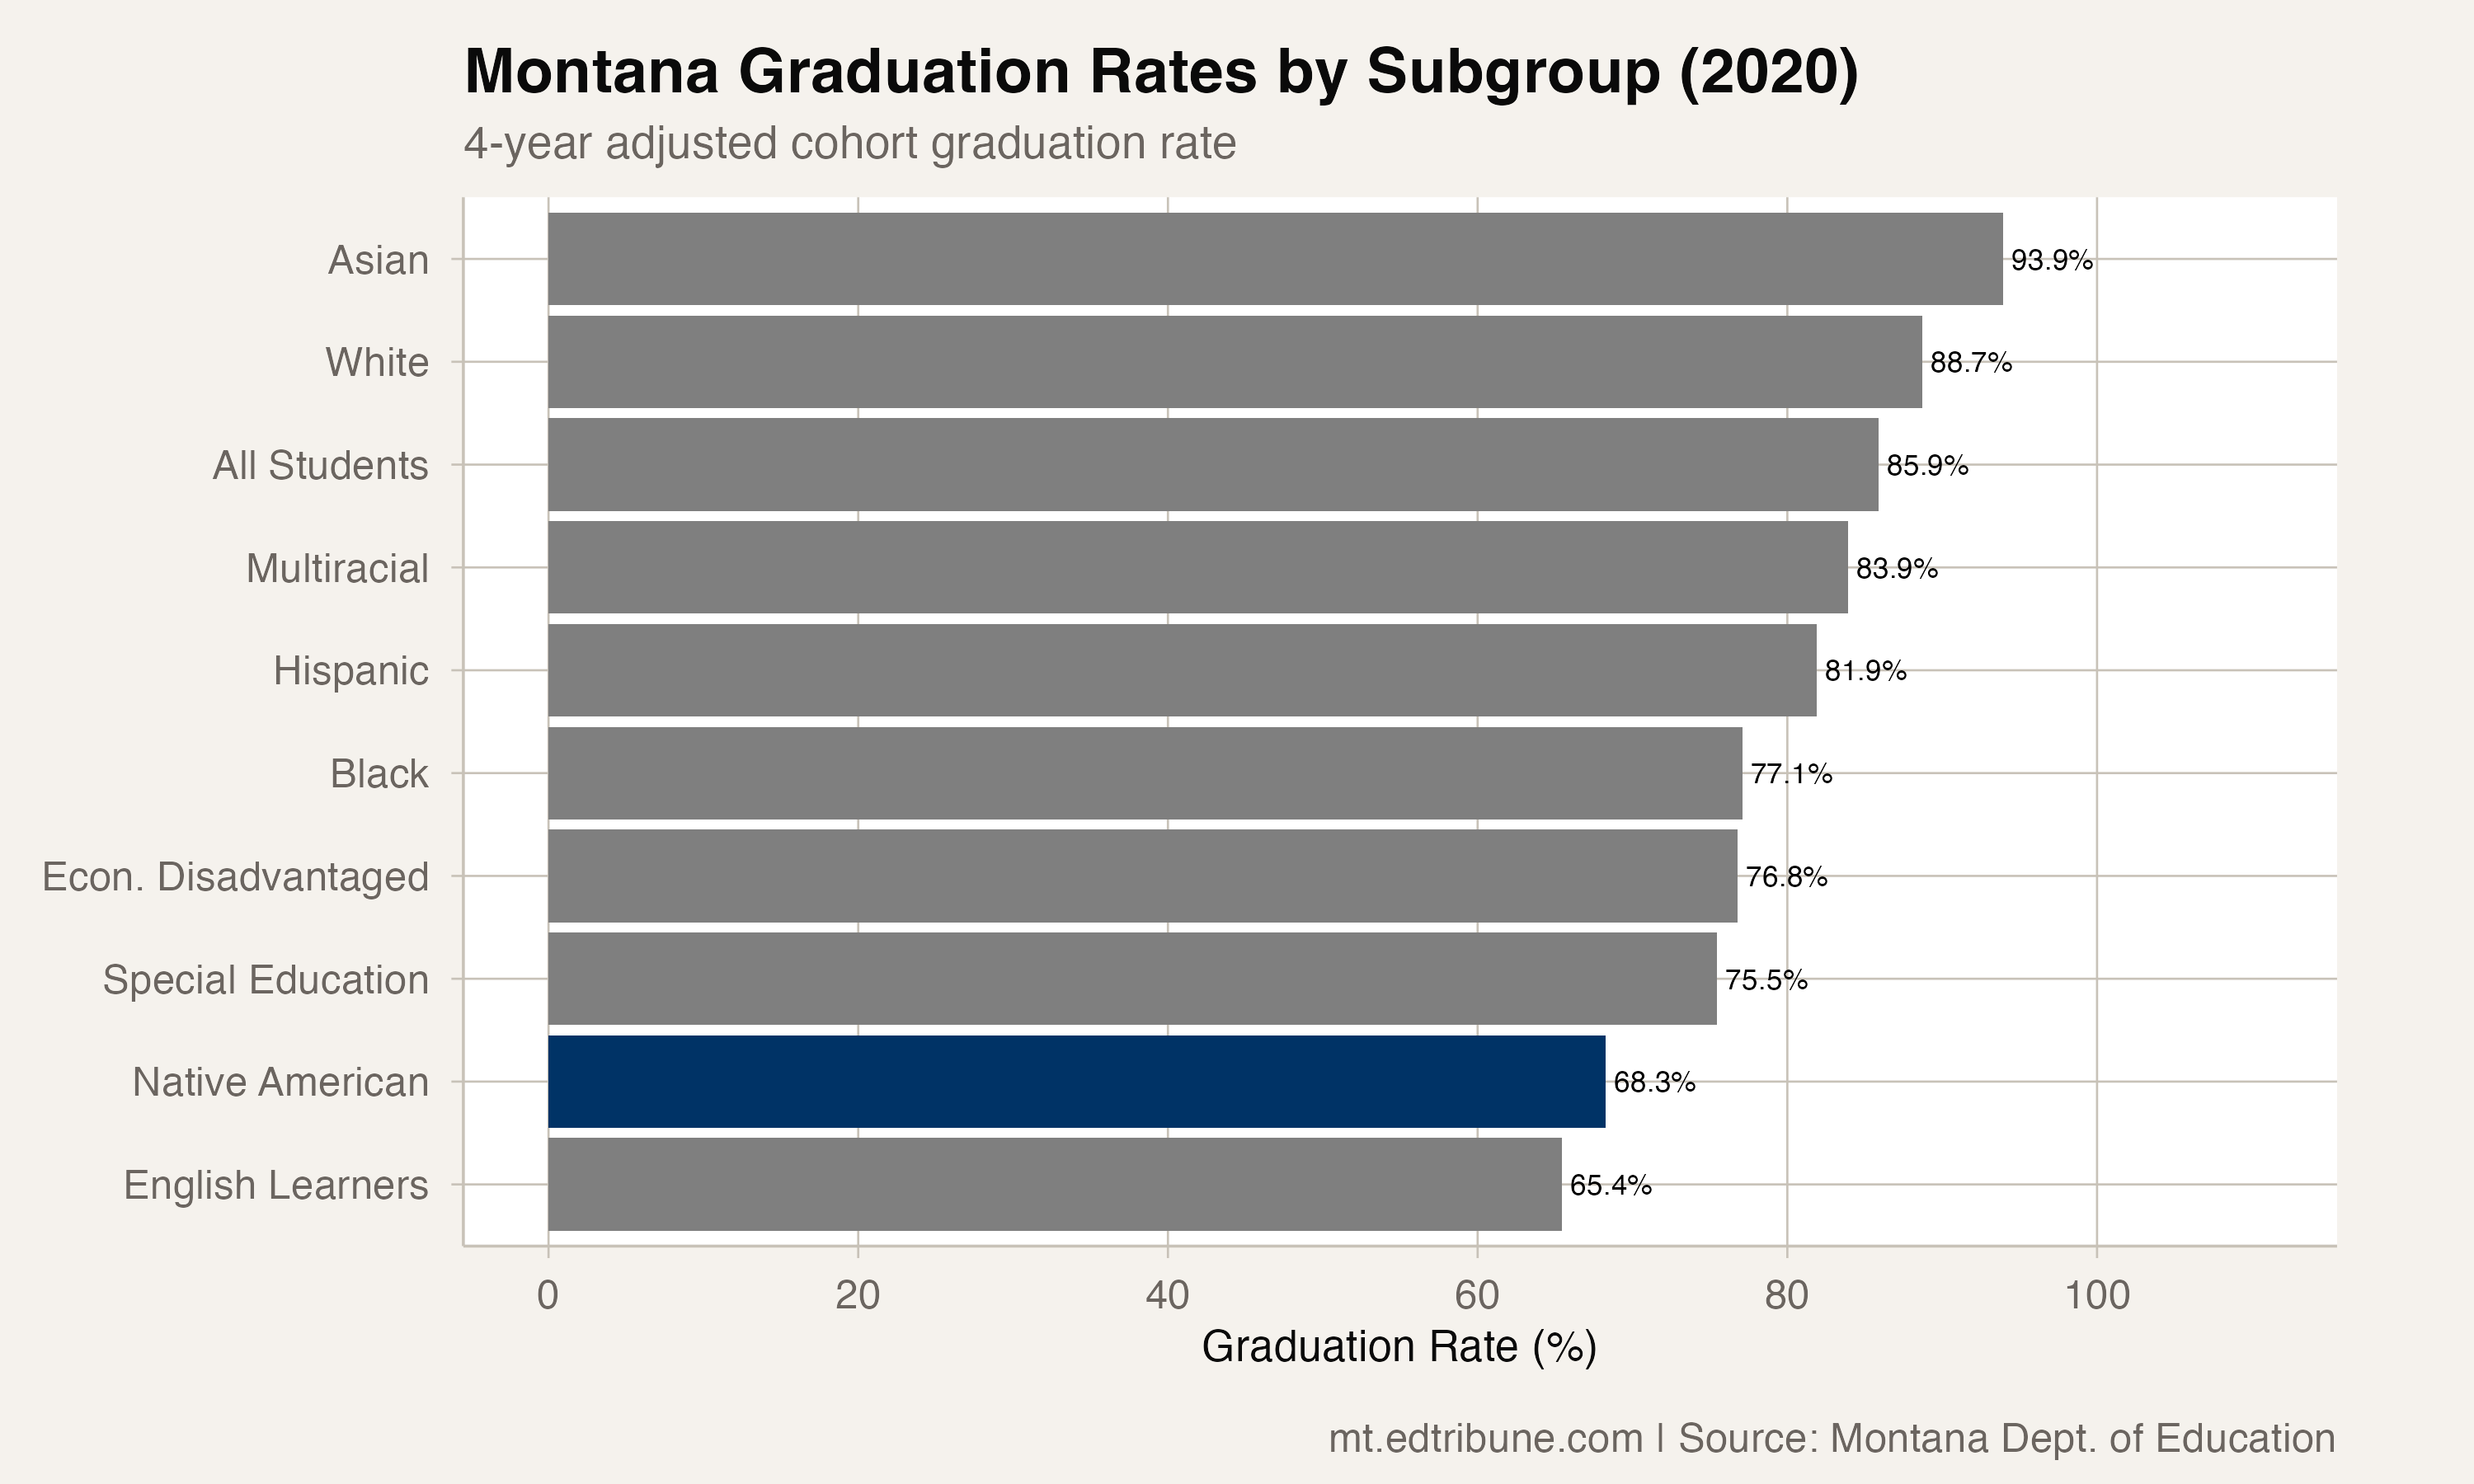
The 2020 subgroup comparison
Among the ten subgroups selected for the 2020 chart, Native American students' 68.3% rate was above only the 65.4% rate for English Learners. Among the racial groups shown, the next-lowest rate was 77.1% for Black students, 8.8 points above the Native American rate. The Asian rate was 93.9%, 25.7 points higher.
From 2011 to 2020, the Native American rate increased from 61.8% to 68.3%, a 6.4-point improvement using the rounded annual rates. English Learners improved by 8.9 points, the largest increase among the package's paired subgroup rows, while the White rate increased by 3.9 points.
What the series supports
The package supports a statewide comparison, not an explanation for the gap. It does not establish how funding, policy, legal disputes, local programs or other mechanisms affected these rates. It also does not provide a White statewide value after 2020 or a Native American statewide value for 2024, so the White-Native gap cannot be extended beyond 2020 with this file.
Analysis uses four-year adjusted cohort graduation-rate rows sourced from the Montana Office of Public Instruction. The audited comparison uses complete White and Native American statewide rows from 2011 through 2020; Native American rows continue through 2023.
Detailed code that reproduces the analysis and figures in this article is available exclusively to EdTribune subscribers.
Discussion
Sign in to join the discussion.
Loading comments...