Correction: An earlier version treated Grade 12 enrollment as the number of students graduating and used the grade pattern to make unsupported causal and predictive claims. Grade 12 enrollment is a count of enrolled twelfth graders, not graduates. The article has been rebuilt around what the current state-grade data directly establish.
Montana's public schools reported 10,036 first graders and 10,421 twelfth graders in 2026. That put Grade 1 enrollment 385 students below Grade 12 enrollment.
Direct evidence: 2026 was the first and only year in the complete nine-year panel from 2018 through 2026 when Grade 1 enrollment was below Grade 12 enrollment. Grade 1 was above Grade 12 in each of the eight earlier years.
The relative position changed substantially across the panel. In 2018, Montana reported 11,387 first graders and 9,614 twelfth graders, or 118.4 first graders per 100 twelfth graders. In 2026, the ratio was 96.3 first graders per 100 twelfth graders.
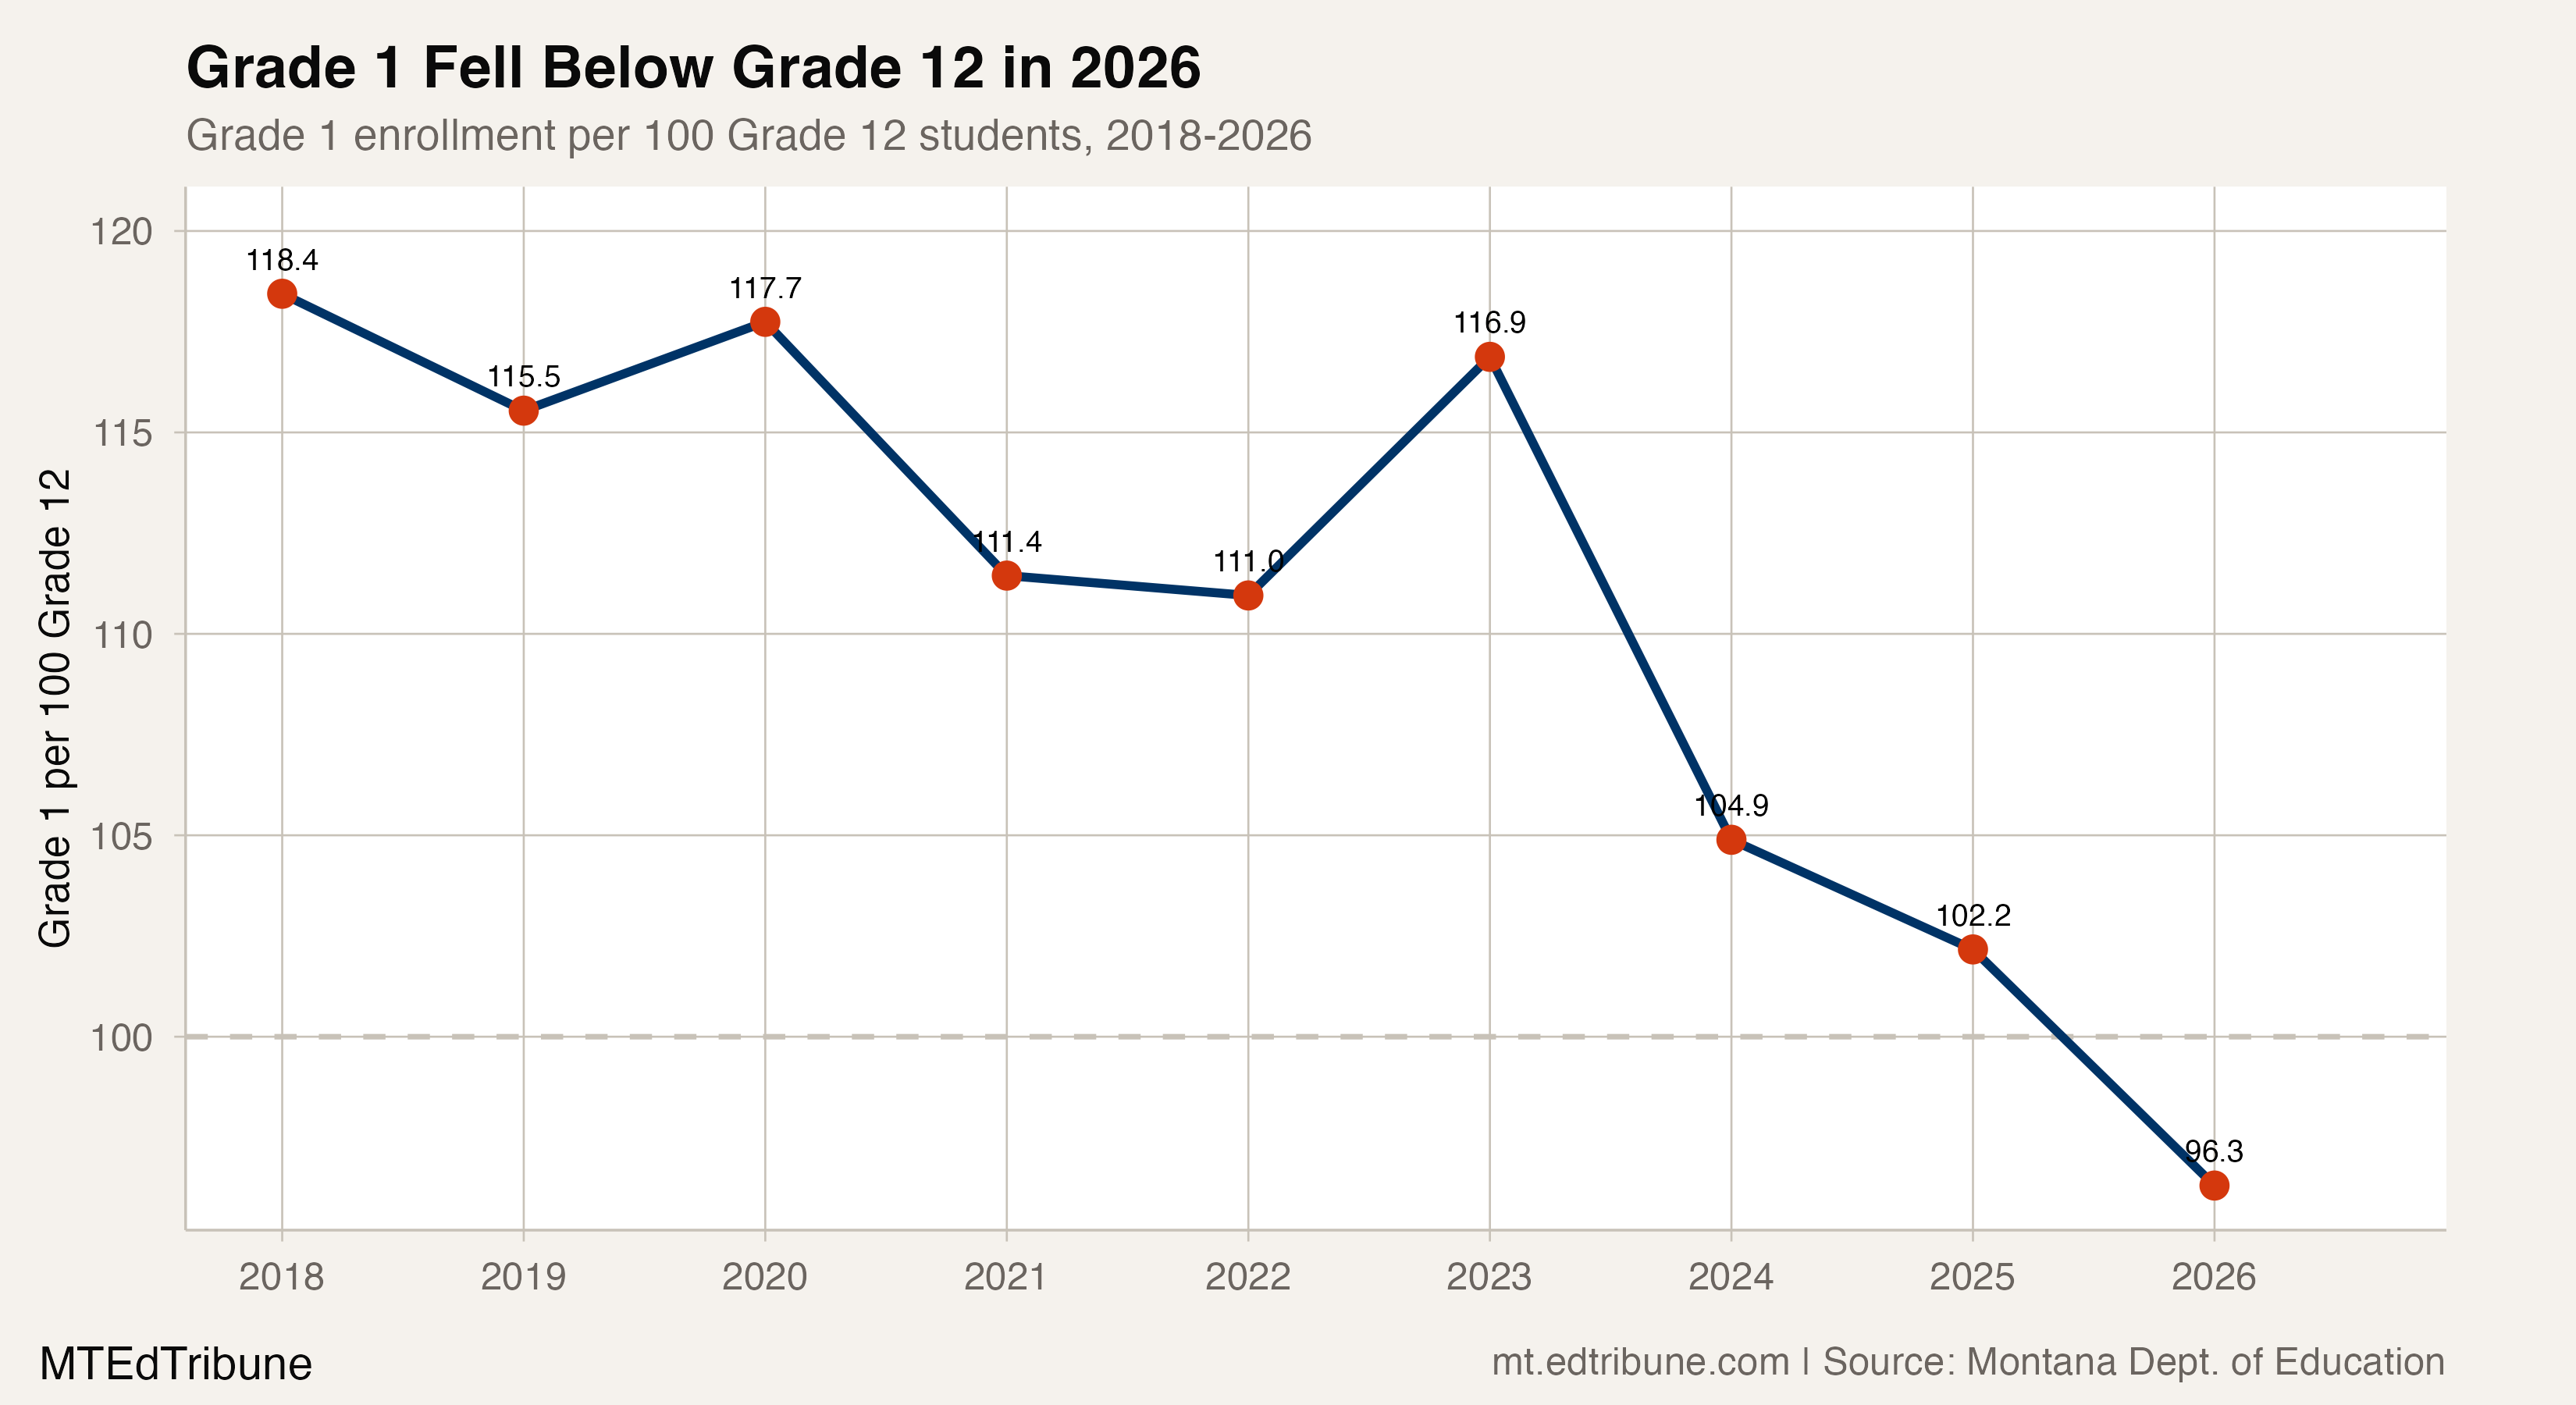
Those figures compare statewide enrollment in two grades at the same point in each school year. They do not count how many students entered public school or graduated, and they do not track the same students from Grade 1 through Grade 12.
The declines were concentrated in earlier grades
The endpoint comparison was not uniform across the grade ladder. Every grade from Pre-K through Grade 6 had fewer students in 2026 than in 2018. Pre-K fell from 1,056 students to 623, a decline of 433 students, or 41.0%. Grade 1 fell by 1,351 students, or 11.9%.
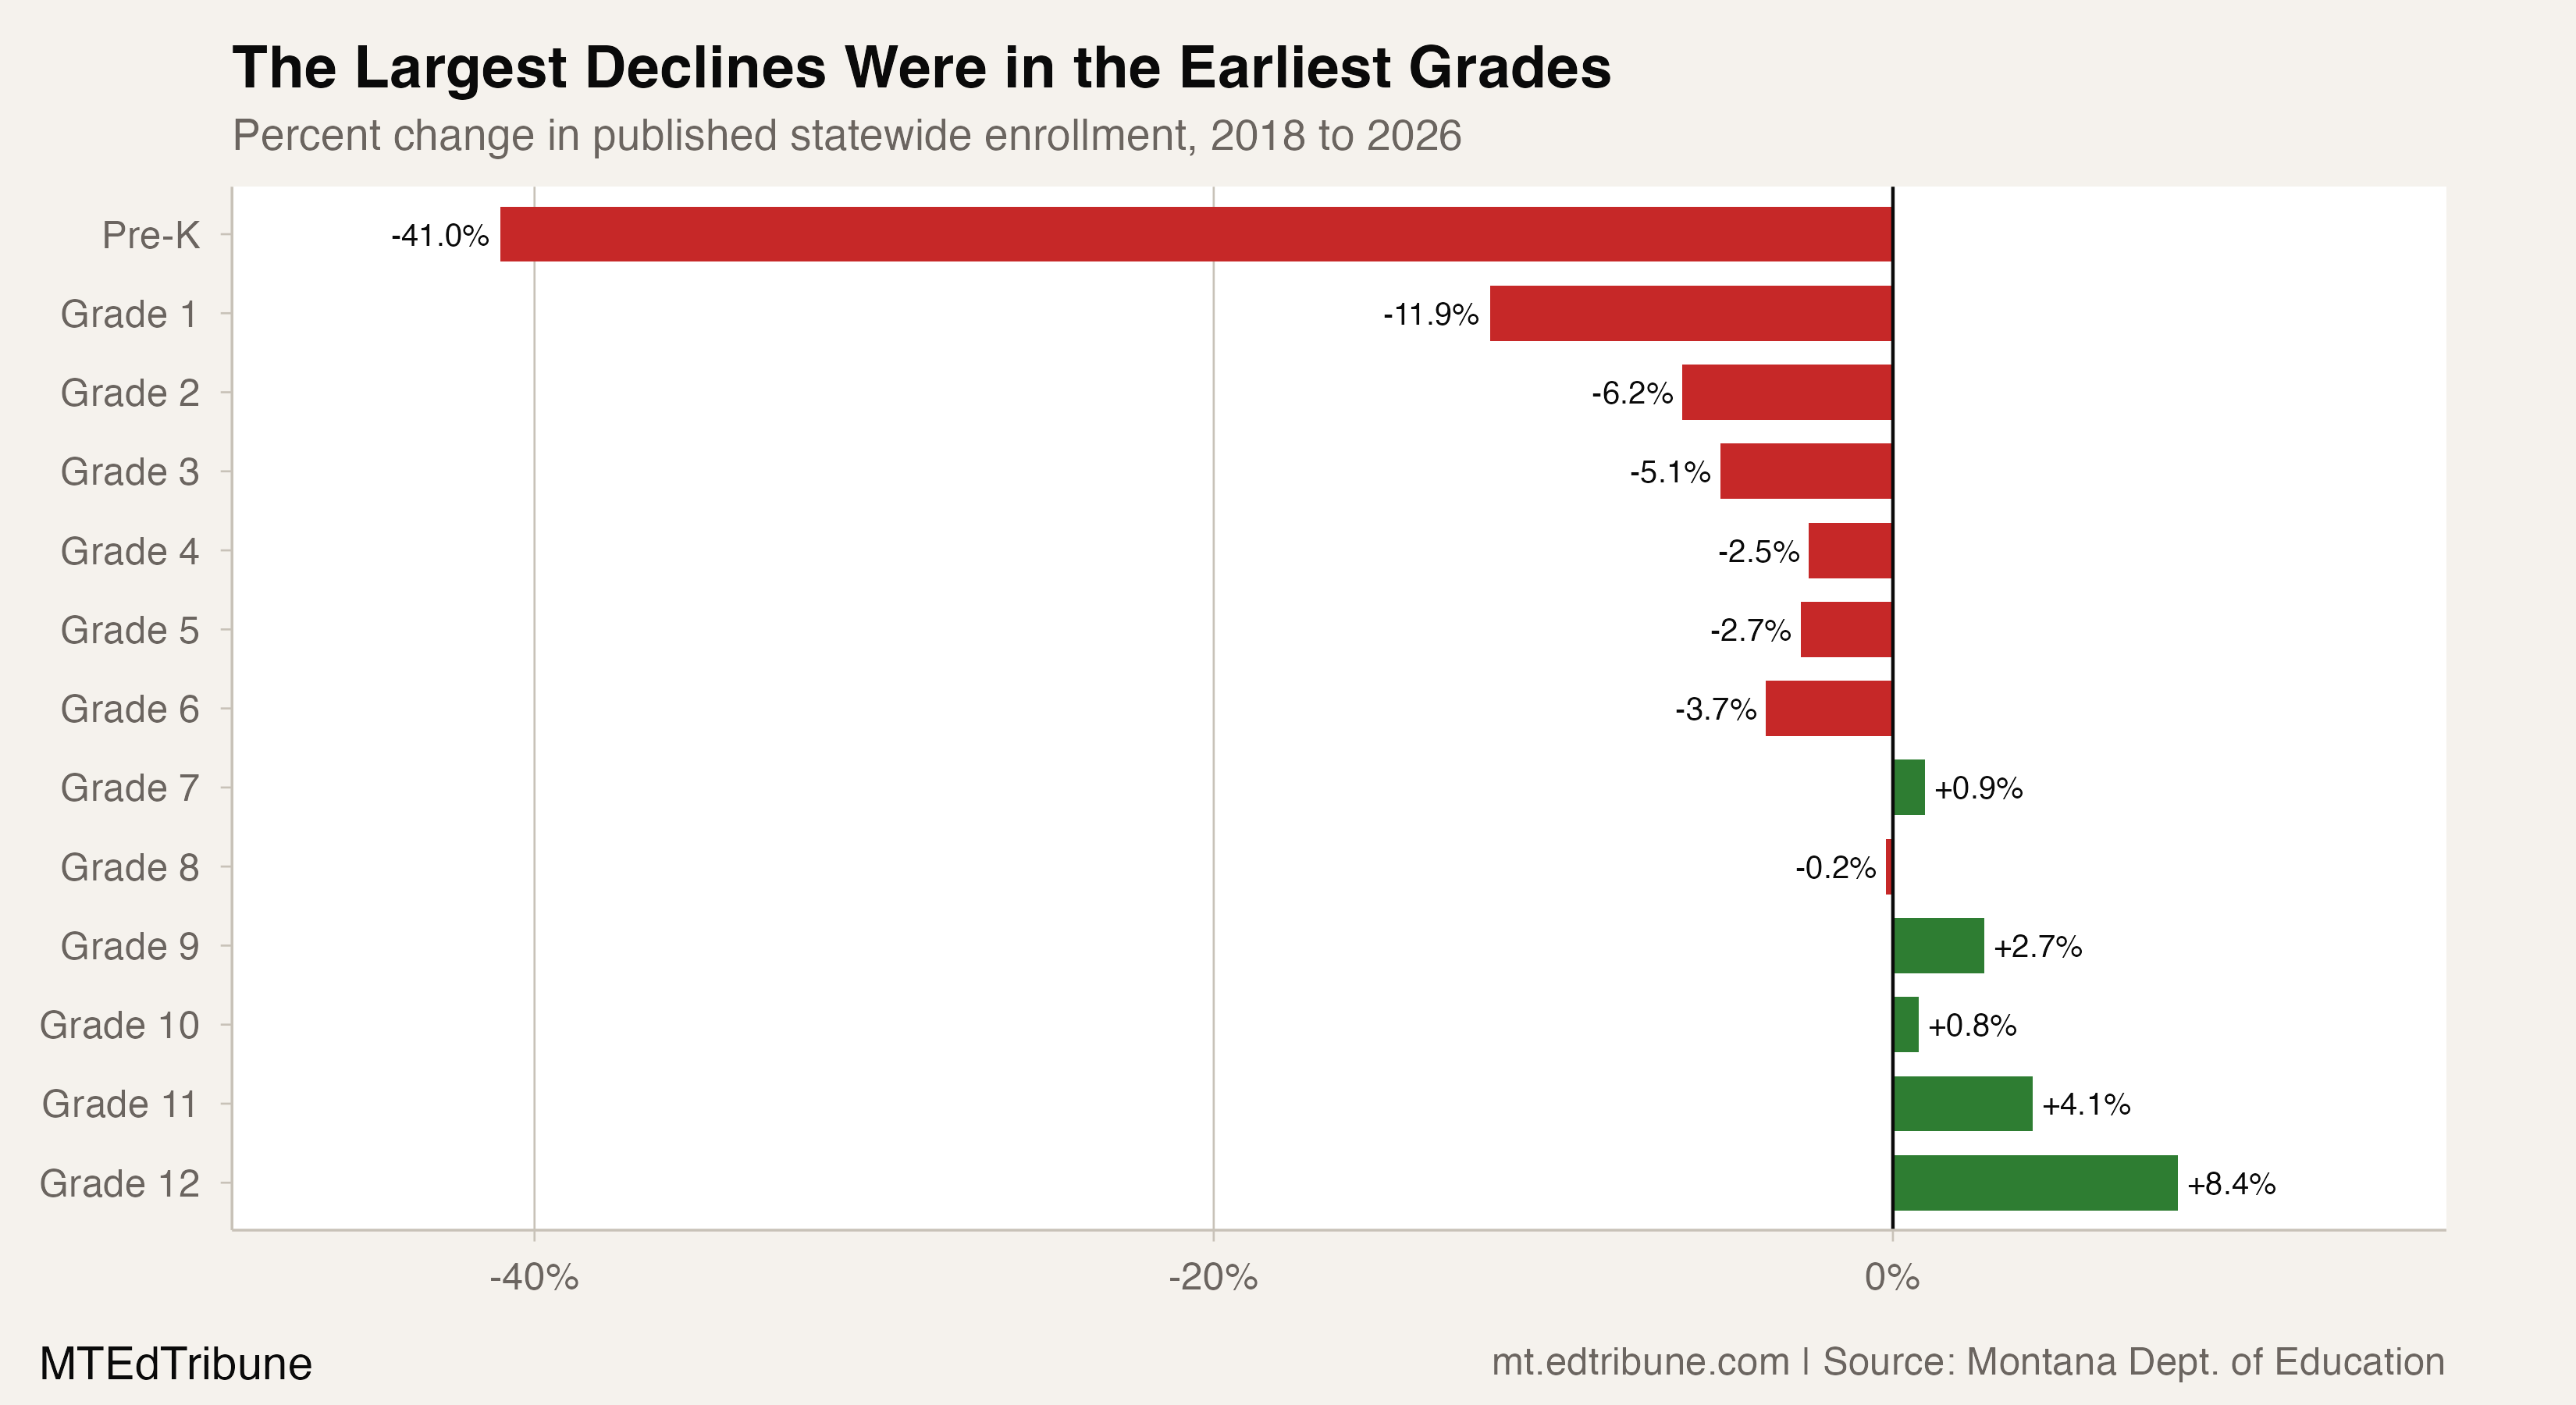
Summing the published statewide grade totals shows the same contrast. Enrollment in Pre-K through Grade 5 fell from 58,773 to 55,097, a loss of 3,676 students, or 6.3%. Grades 6 through 8 declined by 359 students, or 1.0%.
Grades 9 through 12 moved in the other direction across the two endpoints. Their combined enrollment rose from 42,116 in 2018 to 43,736 in 2026, an increase of 1,620 students, or 3.8%.
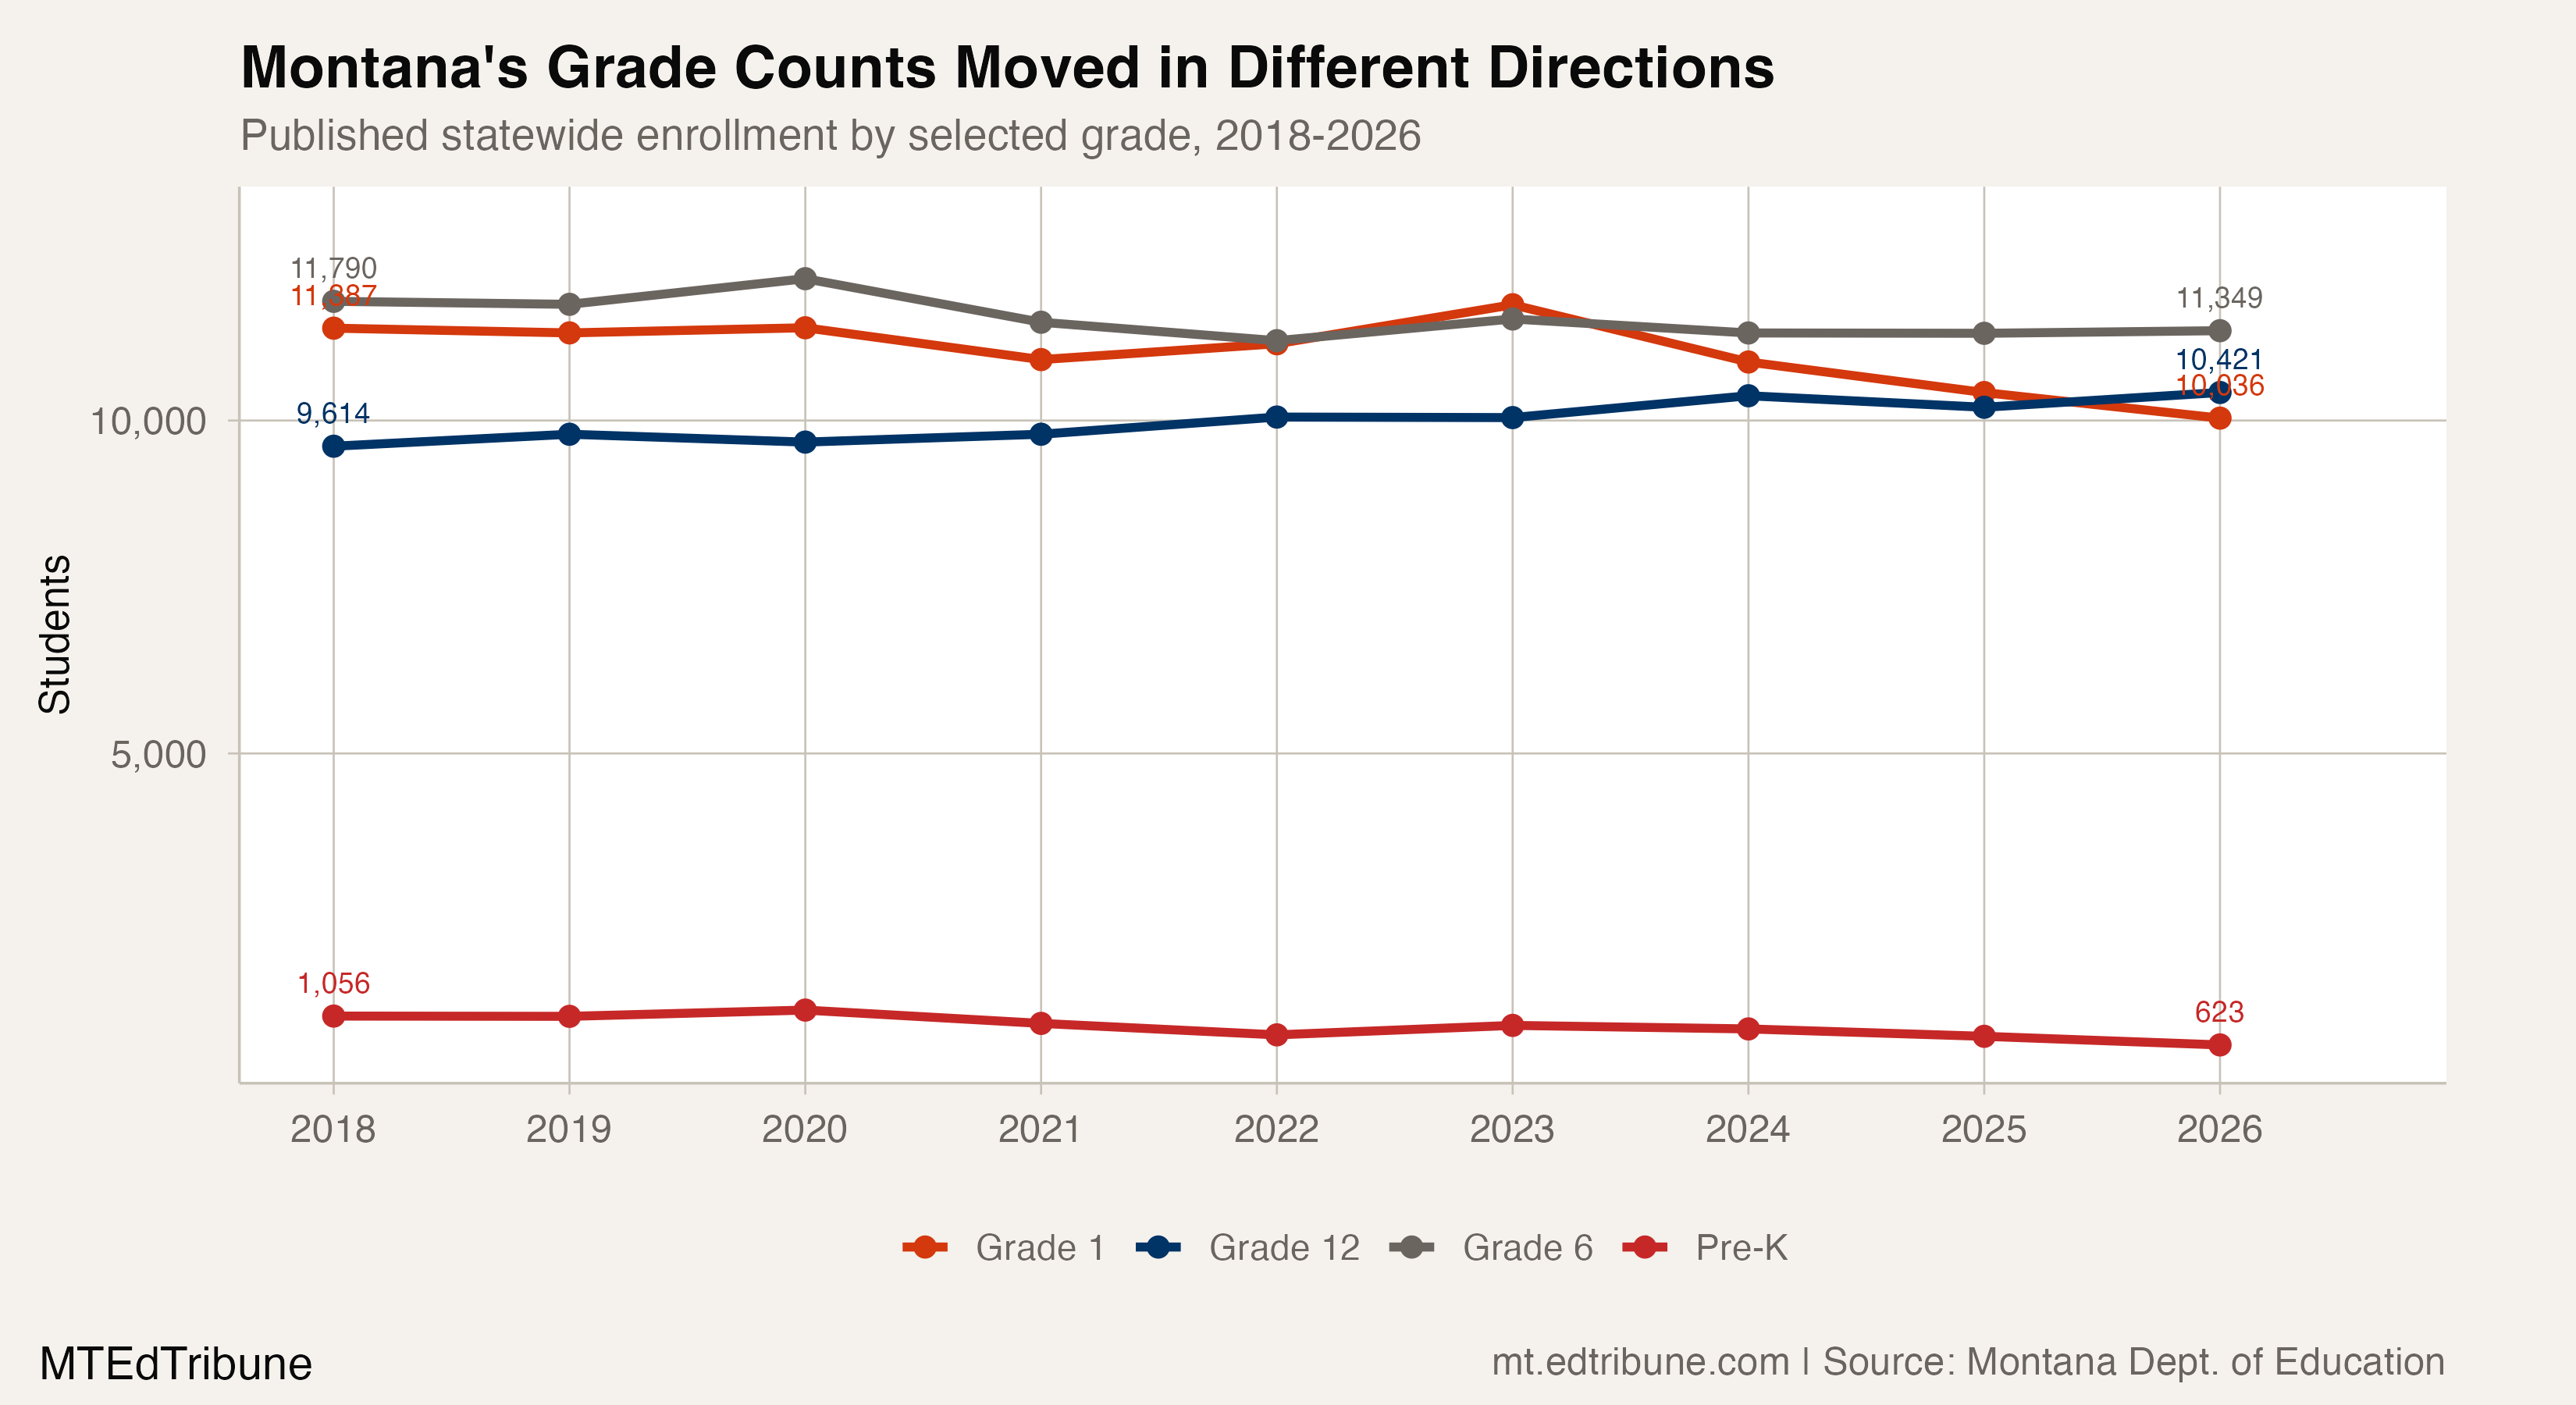
Direct evidence: these changes explain how the Grade 1-to-Grade 12 crossover emerged in the available panel. They do not, by themselves, explain why the grade counts changed.
The high-school total has already moved off its panel peak
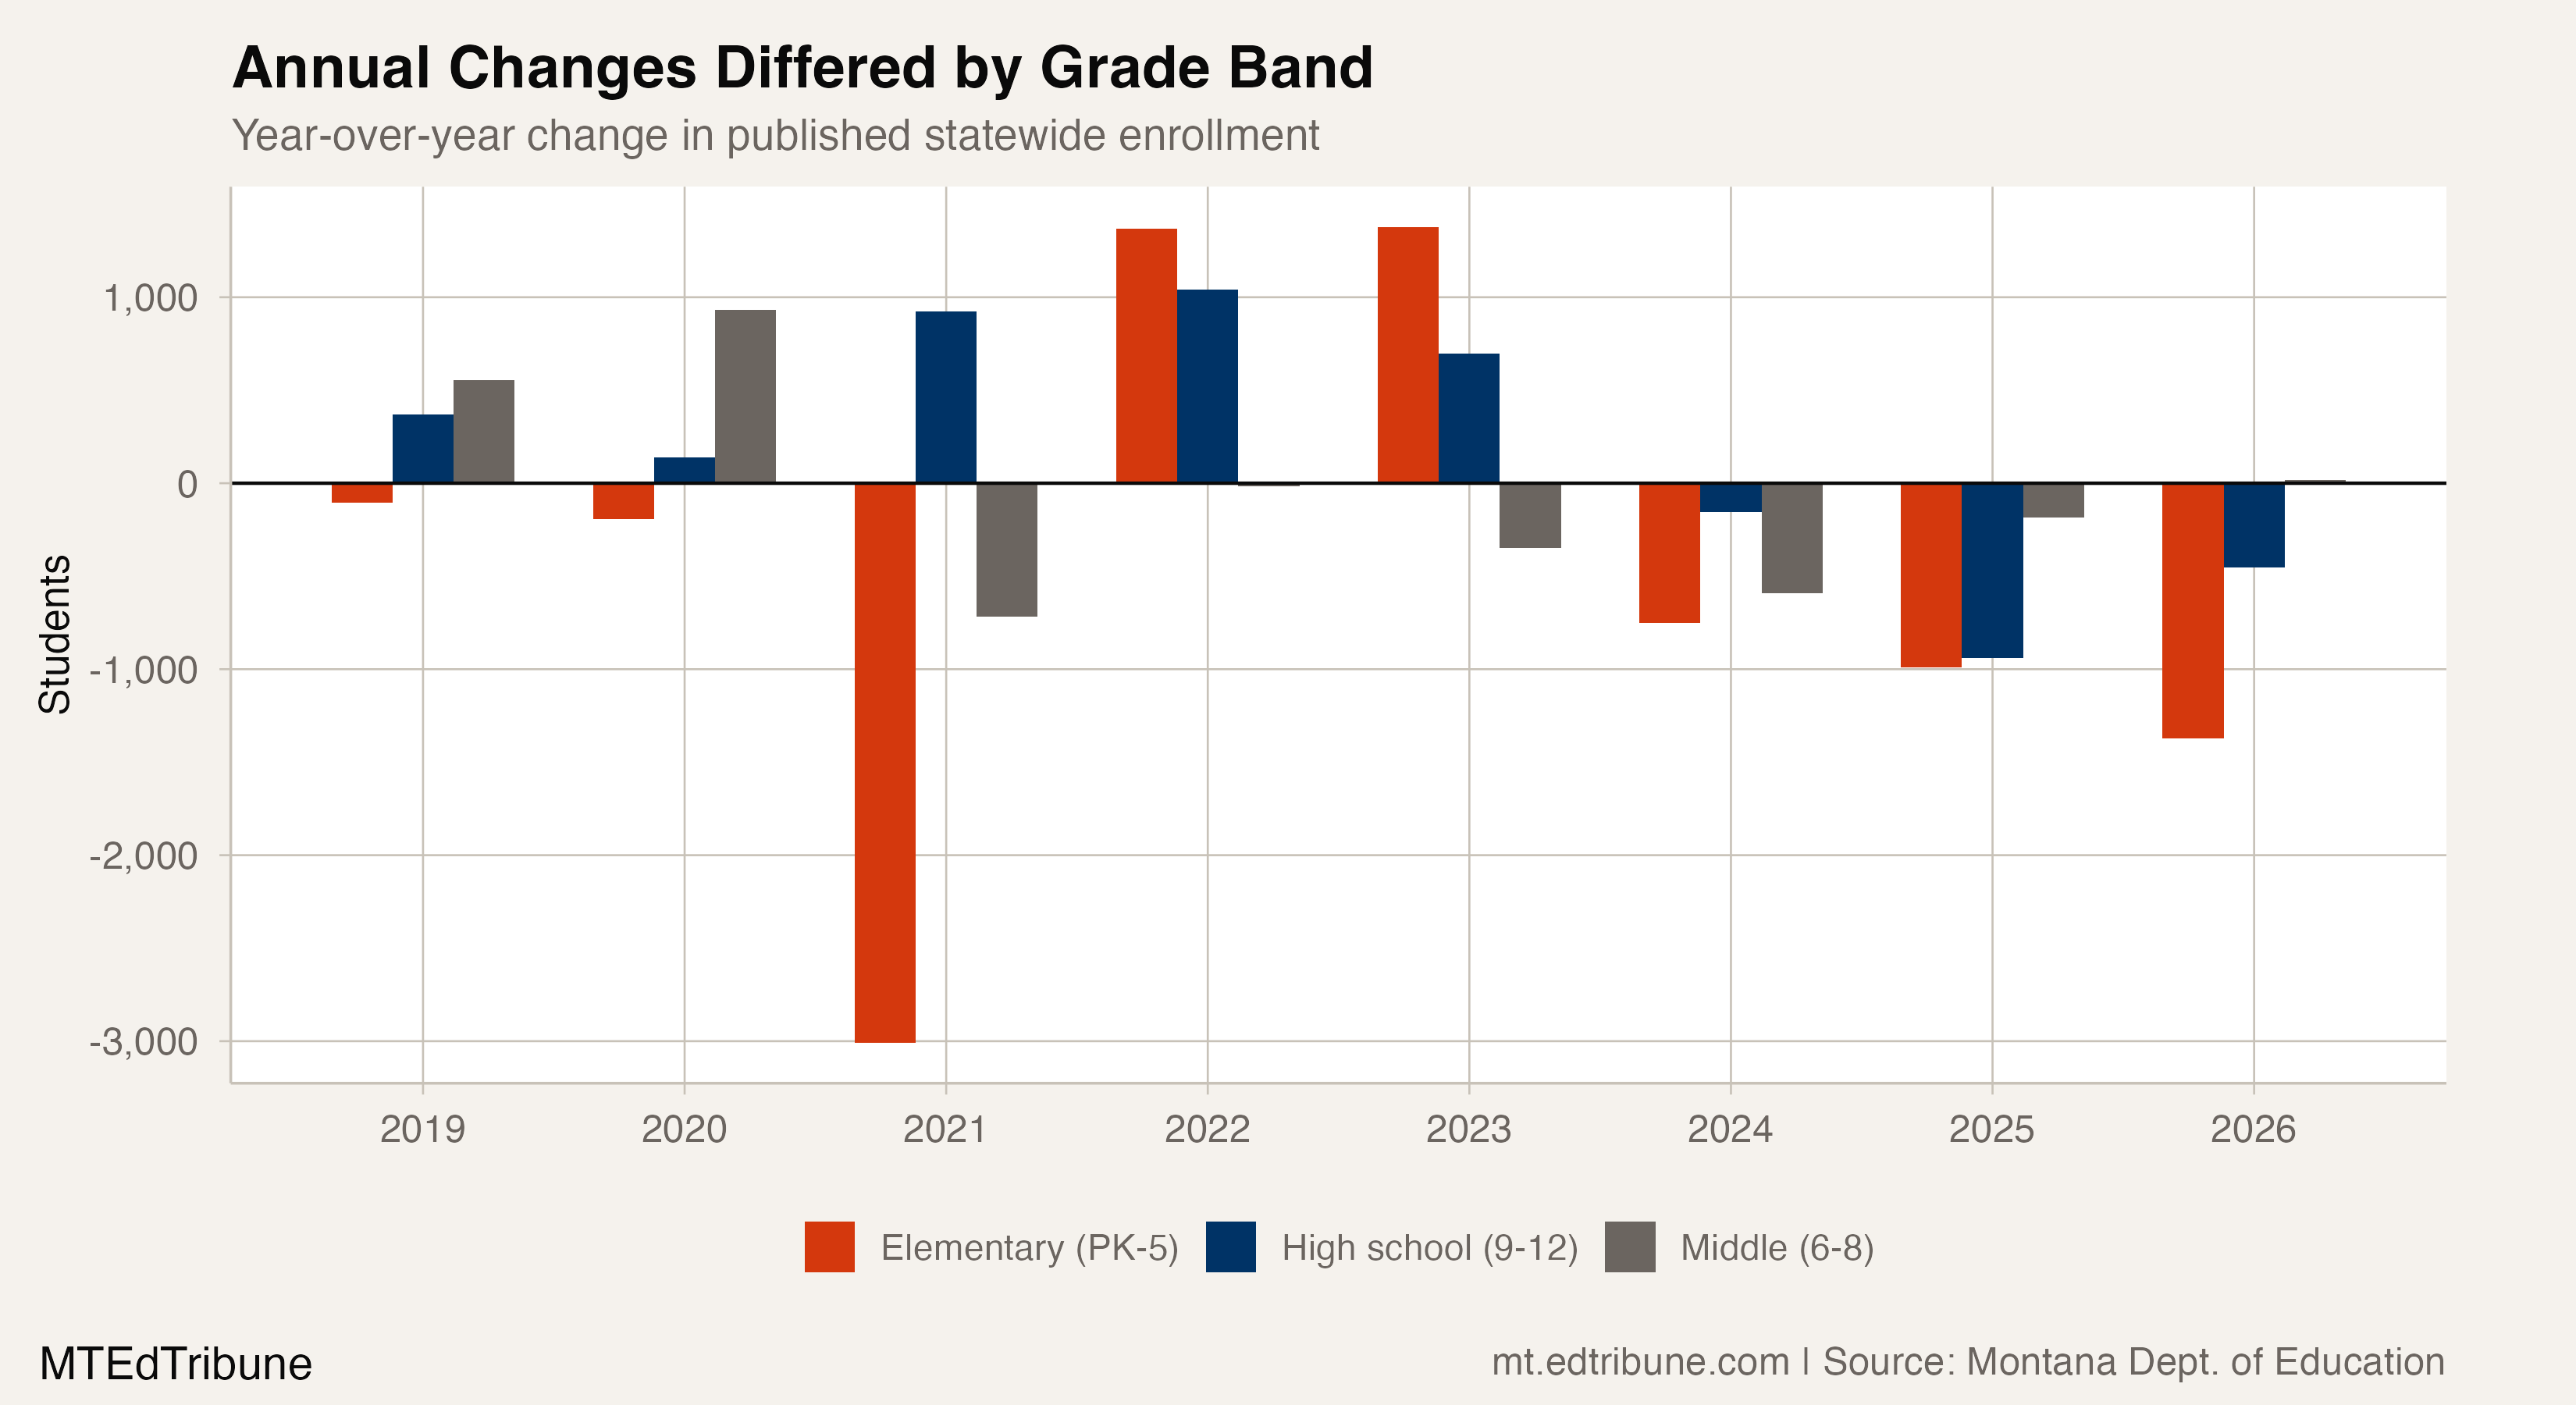
The high-school endpoint gain does not mean the latest annual direction was upward. Combined enrollment in Grades 9 through 12 reached its panel peak at 45,287 students in 2023. It stood at 43,736 in 2026, a decline of 1,551 students from that peak.
The year-over-year grade-band chart shows that the three bands did not move together in every year. It also shows why a comparison of only 2018 and 2026 should not be read as a steady annual path.
Grade 9 was consistently larger than the prior year's Grade 8
There is one additional pattern in the state totals. In all eight comparisons from 2019 through 2026, the current Grade 9 count exceeded the prior year's Grade 8 count. The differences ranged from 196 to 525 students.
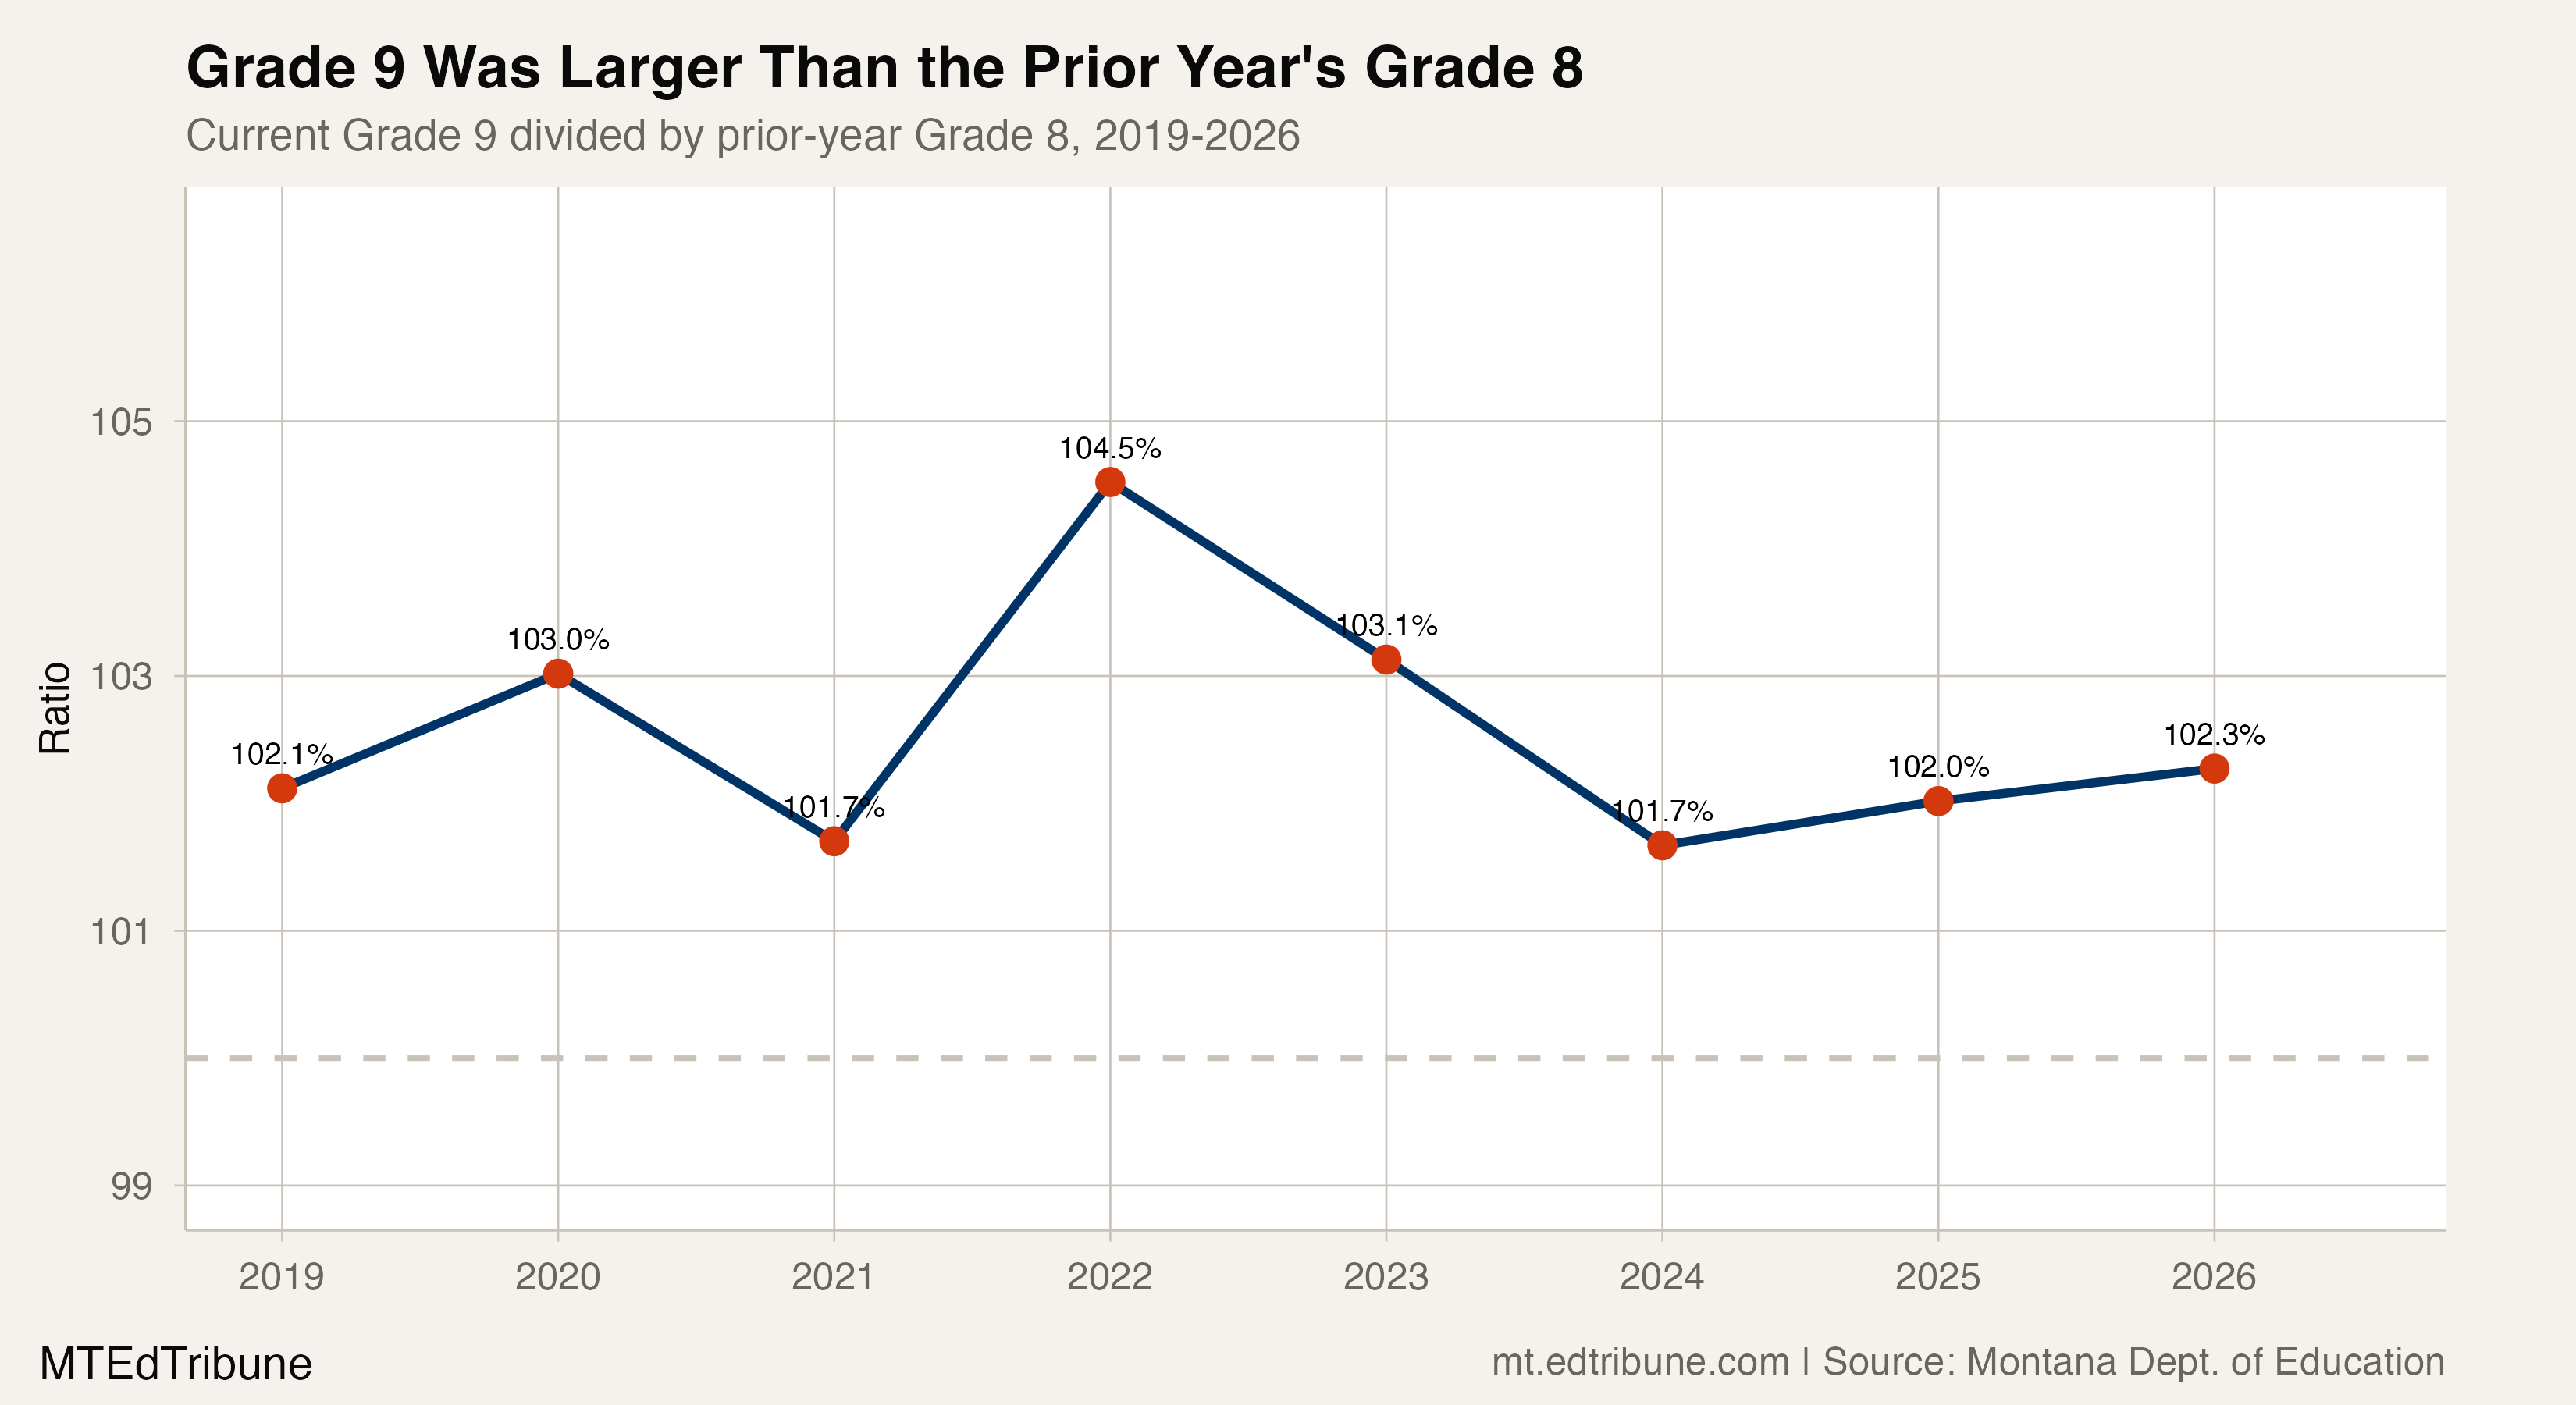
This is an adjacent-grade comparison, not a student-level transition rate. The enrollment file does not identify which students were present in both rows or why the counts differ. It therefore cannot establish a mechanism for the pattern.
The defensible conclusion is narrower than the earlier version of this article: Montana's published state-grade panel shows a real change in the balance between early and late grades. In 2026, the state reported 385 fewer first graders than twelfth graders. The data establish that crossover; they do not turn it into a graduation count, a causal explanation, or a projection.
The MTEdTribune contacted four representatives of the Montana Office of Public Instruction for comment and did not receive a response before publication.
Detailed code that reproduces the analysis and figures in this article is available exclusively to EdTribune subscribers.
Discussion
Sign in to join the discussion.
Loading comments...